I finally got around to mapping the territorial evolution of the Roman Catholic Archdiocese of Cincinnati, where I went to parochial school, from when it covered the entirety of Ohio to its present-day boundaries in the southwestern corner of the state.
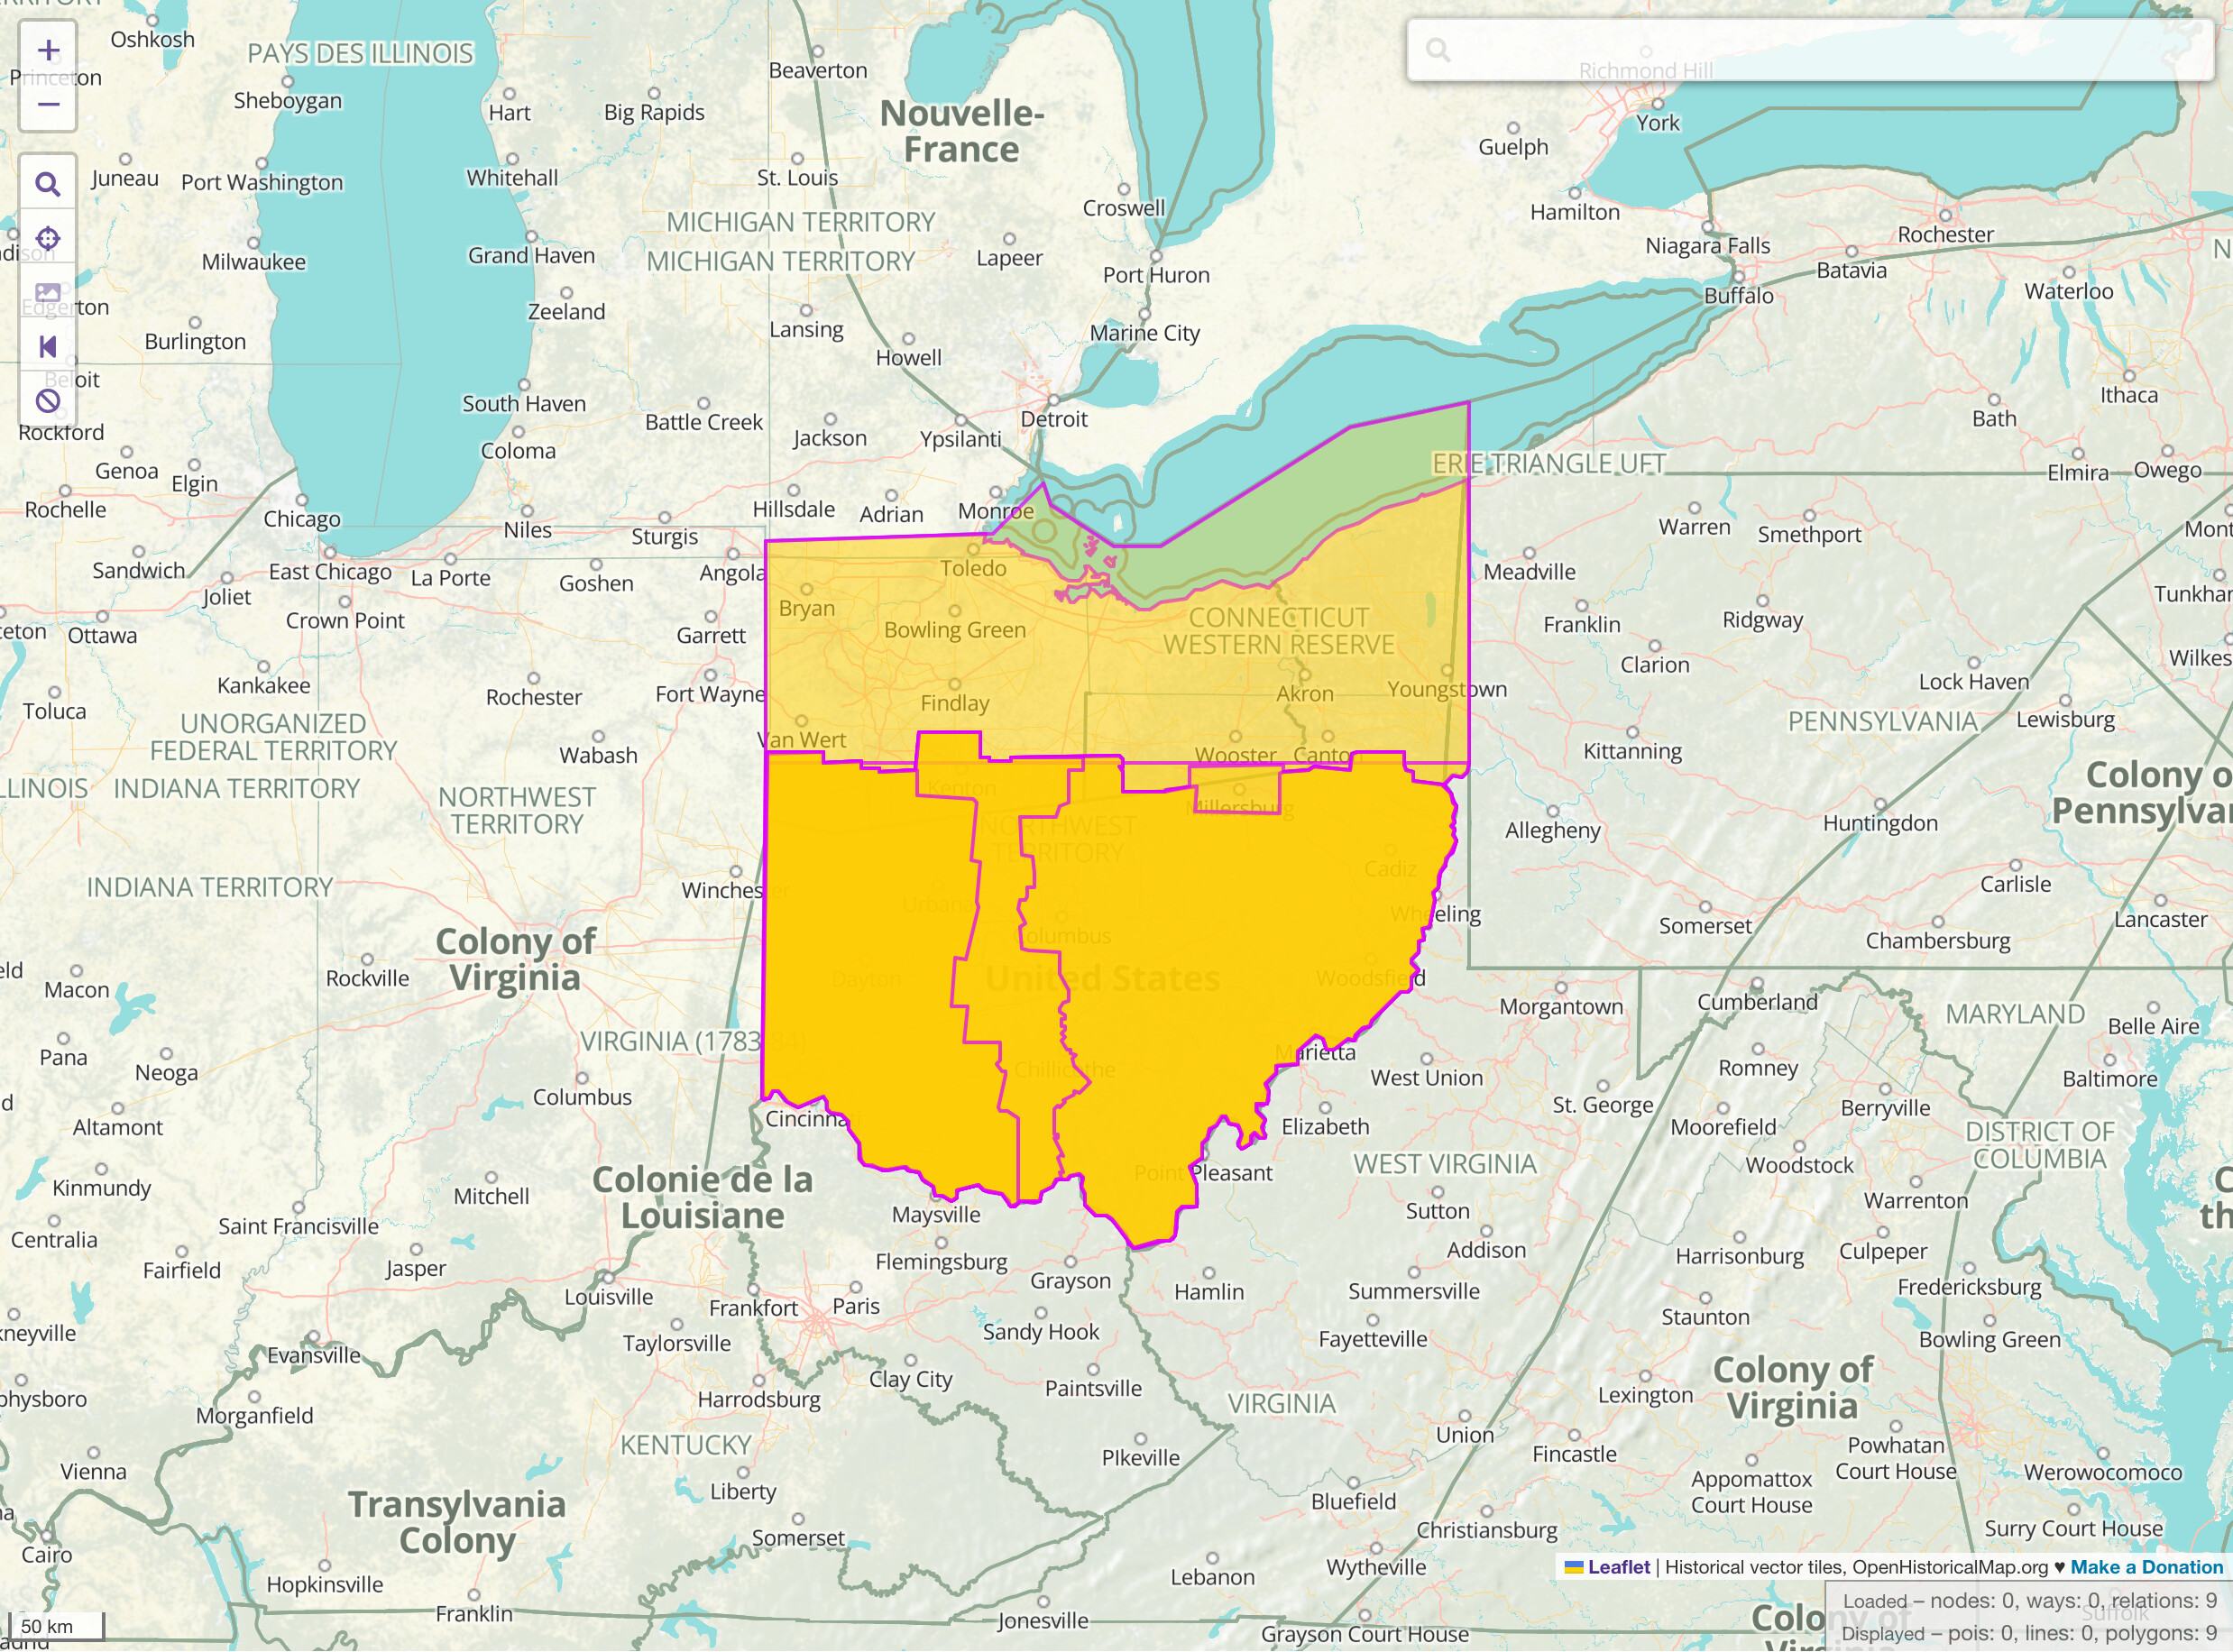
You are here
I’ve always been interested in mapping boundaries other than the usual civil administrative boundaries: time zone boundaries, area code boundaries, ecclesiastical boundaries. All these things are worth mapping, or Wikipedia articles wouldn’t be full of maps of them hand-drawn in Paint. People want to know where things are, where they are. For practicing Catholics, the diocese you live in also affects your lived experience – if not day to day, then at least weekend to weekend. For that matter, in Cincinnati, some people still engage in old-fashioned smalltalk by asking which parish you’re from.
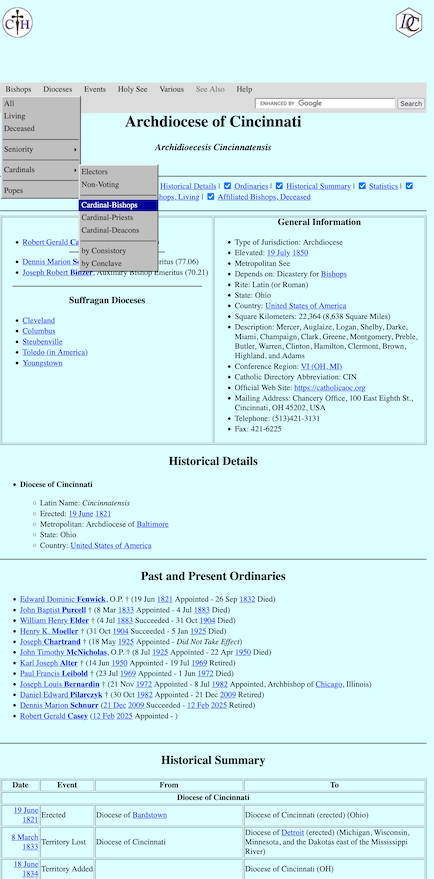
Back in 2015, I had the privilege of meeting David Cheney at attending WikiConference North America. His website, Catholic-Hierarchy, features extensive documentation about notable clergy and their positions, framed by HTML tables against a bright cyan background. It’s a throwback to the early days of the Internet, before Wikipedia became a one-stop shop for encyclopedic knowledge. Back in the day, I’d bookmark his coverage of my diocese right alongside Flags of the World’s coverage of my state flag.
At some point, I was researching a diocese somewhere in Argentina to fix a Wikipedia article and learned from Catholic-Hierarchy that its boundaries don’t strictly follow the local civil administrative boundaries. This was a bit of a revelation to me. I assumed all diocesan boundaries in the U.S. are organized along county lines and that’s basically how it works everywhere else in the world. In fact, they can be just as complex as any other kind of boundary. Yet the site has not a single map. As I recall from my chat with David in 2015, mapping these territories seemed like a good idea to both of us, but neither of us had a good idea of how to pull it off as hobbyists.
A different kind of boundary
As a mapper, I wanted to help. Unfortunately, ecclesiastical boundaries aren’t a natural fit for OpenStreetMap, which prioritizes directly observable features. In OSM community spaces, there’s even plenty of frustration at the clutter of civil administrative boundaries and unwieldy time zone boundaries. Some question whether boundaries of any kind really belong on a map of what’s “on the ground”, but they tolerate civil boundaries – just barely – because everyone expects them on a general-purpose map to find their way around. A diocesan boundary is much more niche, only of interest to someone who’s already interested in the diocese.
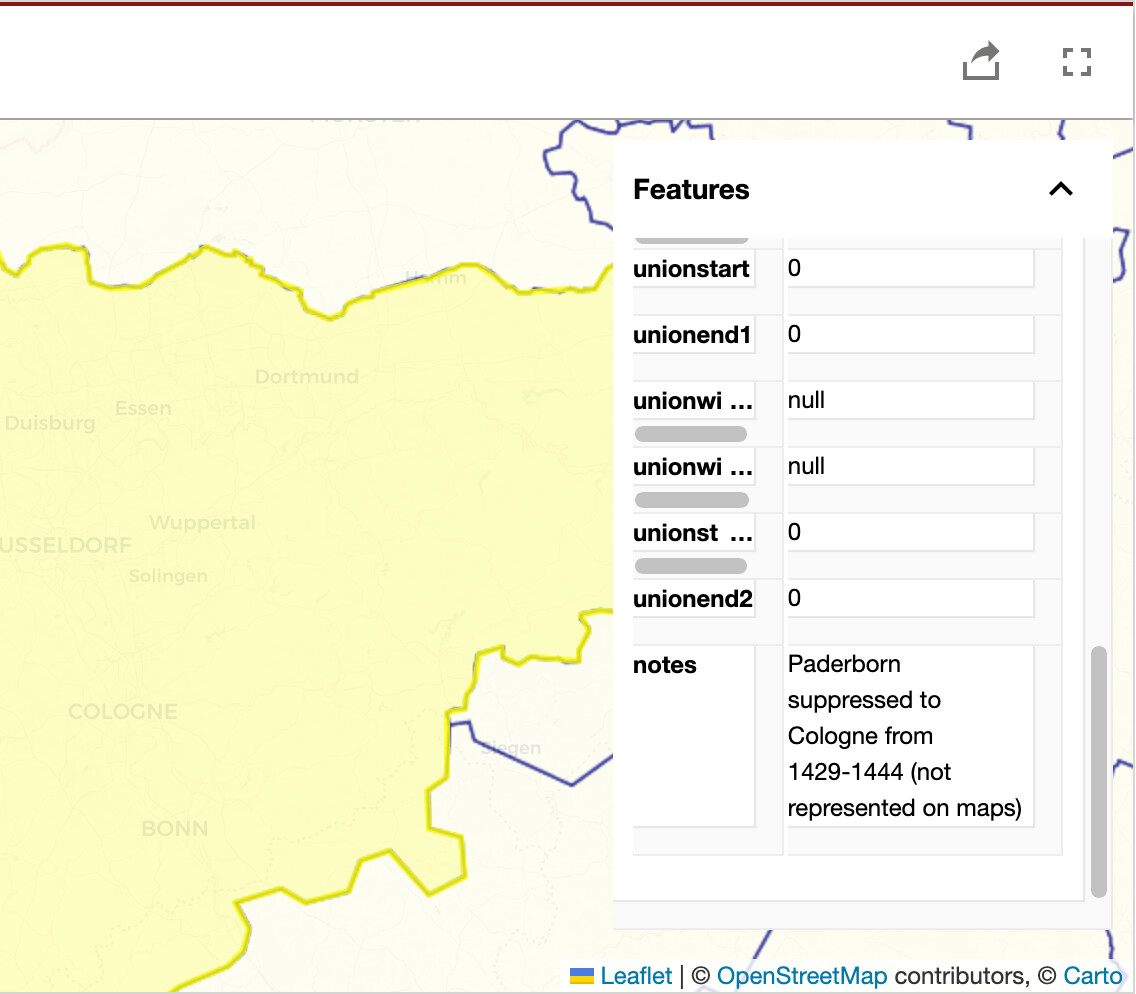
A year ago, someone pointed out in our issue tracker that the Digital Atlas of Dioceses and Ecclesiastical Provinces in Late Medieval Europe maps hundreds of medieval dioceses in Europe. If digital humanities researchers are interested in the development of dioceses over time, then surely we could map them too. With our amazing community and time-sensitive tooling, we could potentially come up with maps that convey more information than their “amalgam” of the study period, and we could extend this effort to other parts of the world and modernity.
When in Rome
As with my earlier time zone boundary effort, I started with the archdiocese’s present-day boundaries, then worked my way back to its establishment as a diocese. The boundaries today follow county lines, so I got the current archdiocesan boundary by downloading the present-day county boundary relations and tracing a new boundary relation around them. But as with anything in OHM, drawing the geometry is only half the challenge. When did the archdiocese arrive at its current shape? Wikipedia only has the year, but fortunately it cites an OCR’d copy of the original apostolic constitution gazetted in the Acta Apostolicae Sedis. I remember just enough trigonometric terms from high school to convert this eschatocol into ISO 8601 format:
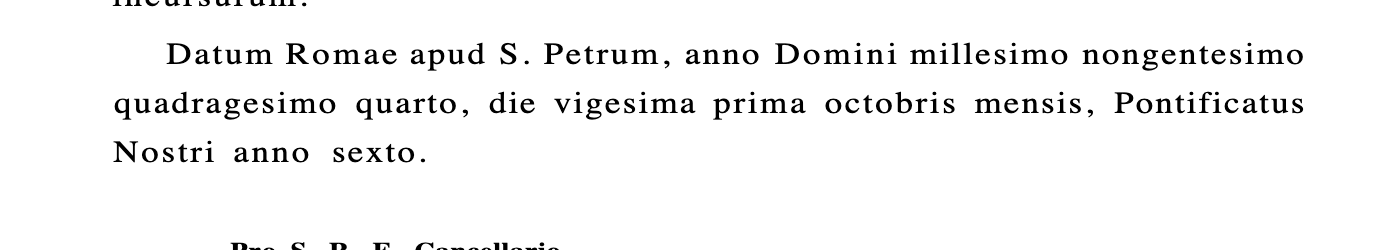
Translation
Given at St. Peter’s, in the year of our Lord one thousand nine hundred and forty-five, the twenty-first day of the month of October, in the sixth year of our Pontificate.
To go back further, I consulted Pontificia Americana: A Documentary History of the Catholic Church in the United States (1784–1884), a 1933 article in a Franciscan academic journal that collates every official diocesan boundary change in the U.S. during the 19th century. A summary in English accompanies the original text of each legal document, sparing me the trouble of translating from Church Latin.
Unfortunately, the article is locked away in JSTOR, a subscription database that’s normally only available to university students and faculty. I’ve been out of school for a number of years, so instead I gained access to this document’s full text by logging into The Wikipedia Library. TWL is available to any active contributor to Wikimedia projects. Many of us qualify for this program just by fixing typos in Wikipedia articles and adding missing statements to Wikidata entries in the course of our research for OHM. All they ask in return is that we continue to contribute our findings back to the Wikimedia projects too.
Some changes substituted Roman formality with American pragmatism. Back in the mid 19th century, the Cincinnati–Cleveland diocesan boundary ran along a line of latitude, but this caused so much chaos that the two bishops locally agreed to divide their responsibilities along county lines instead. An elegant, straight boundary may have been written into law at the Vatican, but in the middle of Ohio, the faithful needed something more familiar. Even then, one of the counties remained in limbo for decades, seemingly because the Archbishop of Cincinnati just didn’t want it. I mapped these de facto boundaries because they’re more relevant to understanding how the archdiocese evolved.
To figure out the boundary relations to create, I had to collate not only the boundary changes in this document but also any changes to the civil boundaries that the diocesan boundaries reference. In the past, tracking these changes would’ve been very difficult, but last year’s import of historical county boundaries makes it just a matter of looking up the county’s chronology relation. Each present-day boundary is a member of one of these relations, and I can also access them through the OpenHistoricalMap relation ID (P8424) statement on the county’s corresponding Wikidata item.
Fortunately, only a couple of the county line changes affected the diocesan boundaries, like when two survey sections were transferred from Troy Township in Morrow County to Troy Township in Richland County. For a time, almost the entire eastern boundary ran along the Scioto River, but I didn’t bother to research historical changes in the river’s course. I’m assuming for the time being that any such change would’ve had a negligible effect on the exercise of religion in the area.
Time to map
I chose JOSM for this mapping project because of its extensive suite of tools for working with relations. For each relevant county, I pasted the chronology relation’s ID into the Download Object dialog, then used the Relations panel to “Download with members” (so that none of the relations are listed as “incomplete”). As I worked backwards in time, I would repeat this step for any other counties that became relevant.
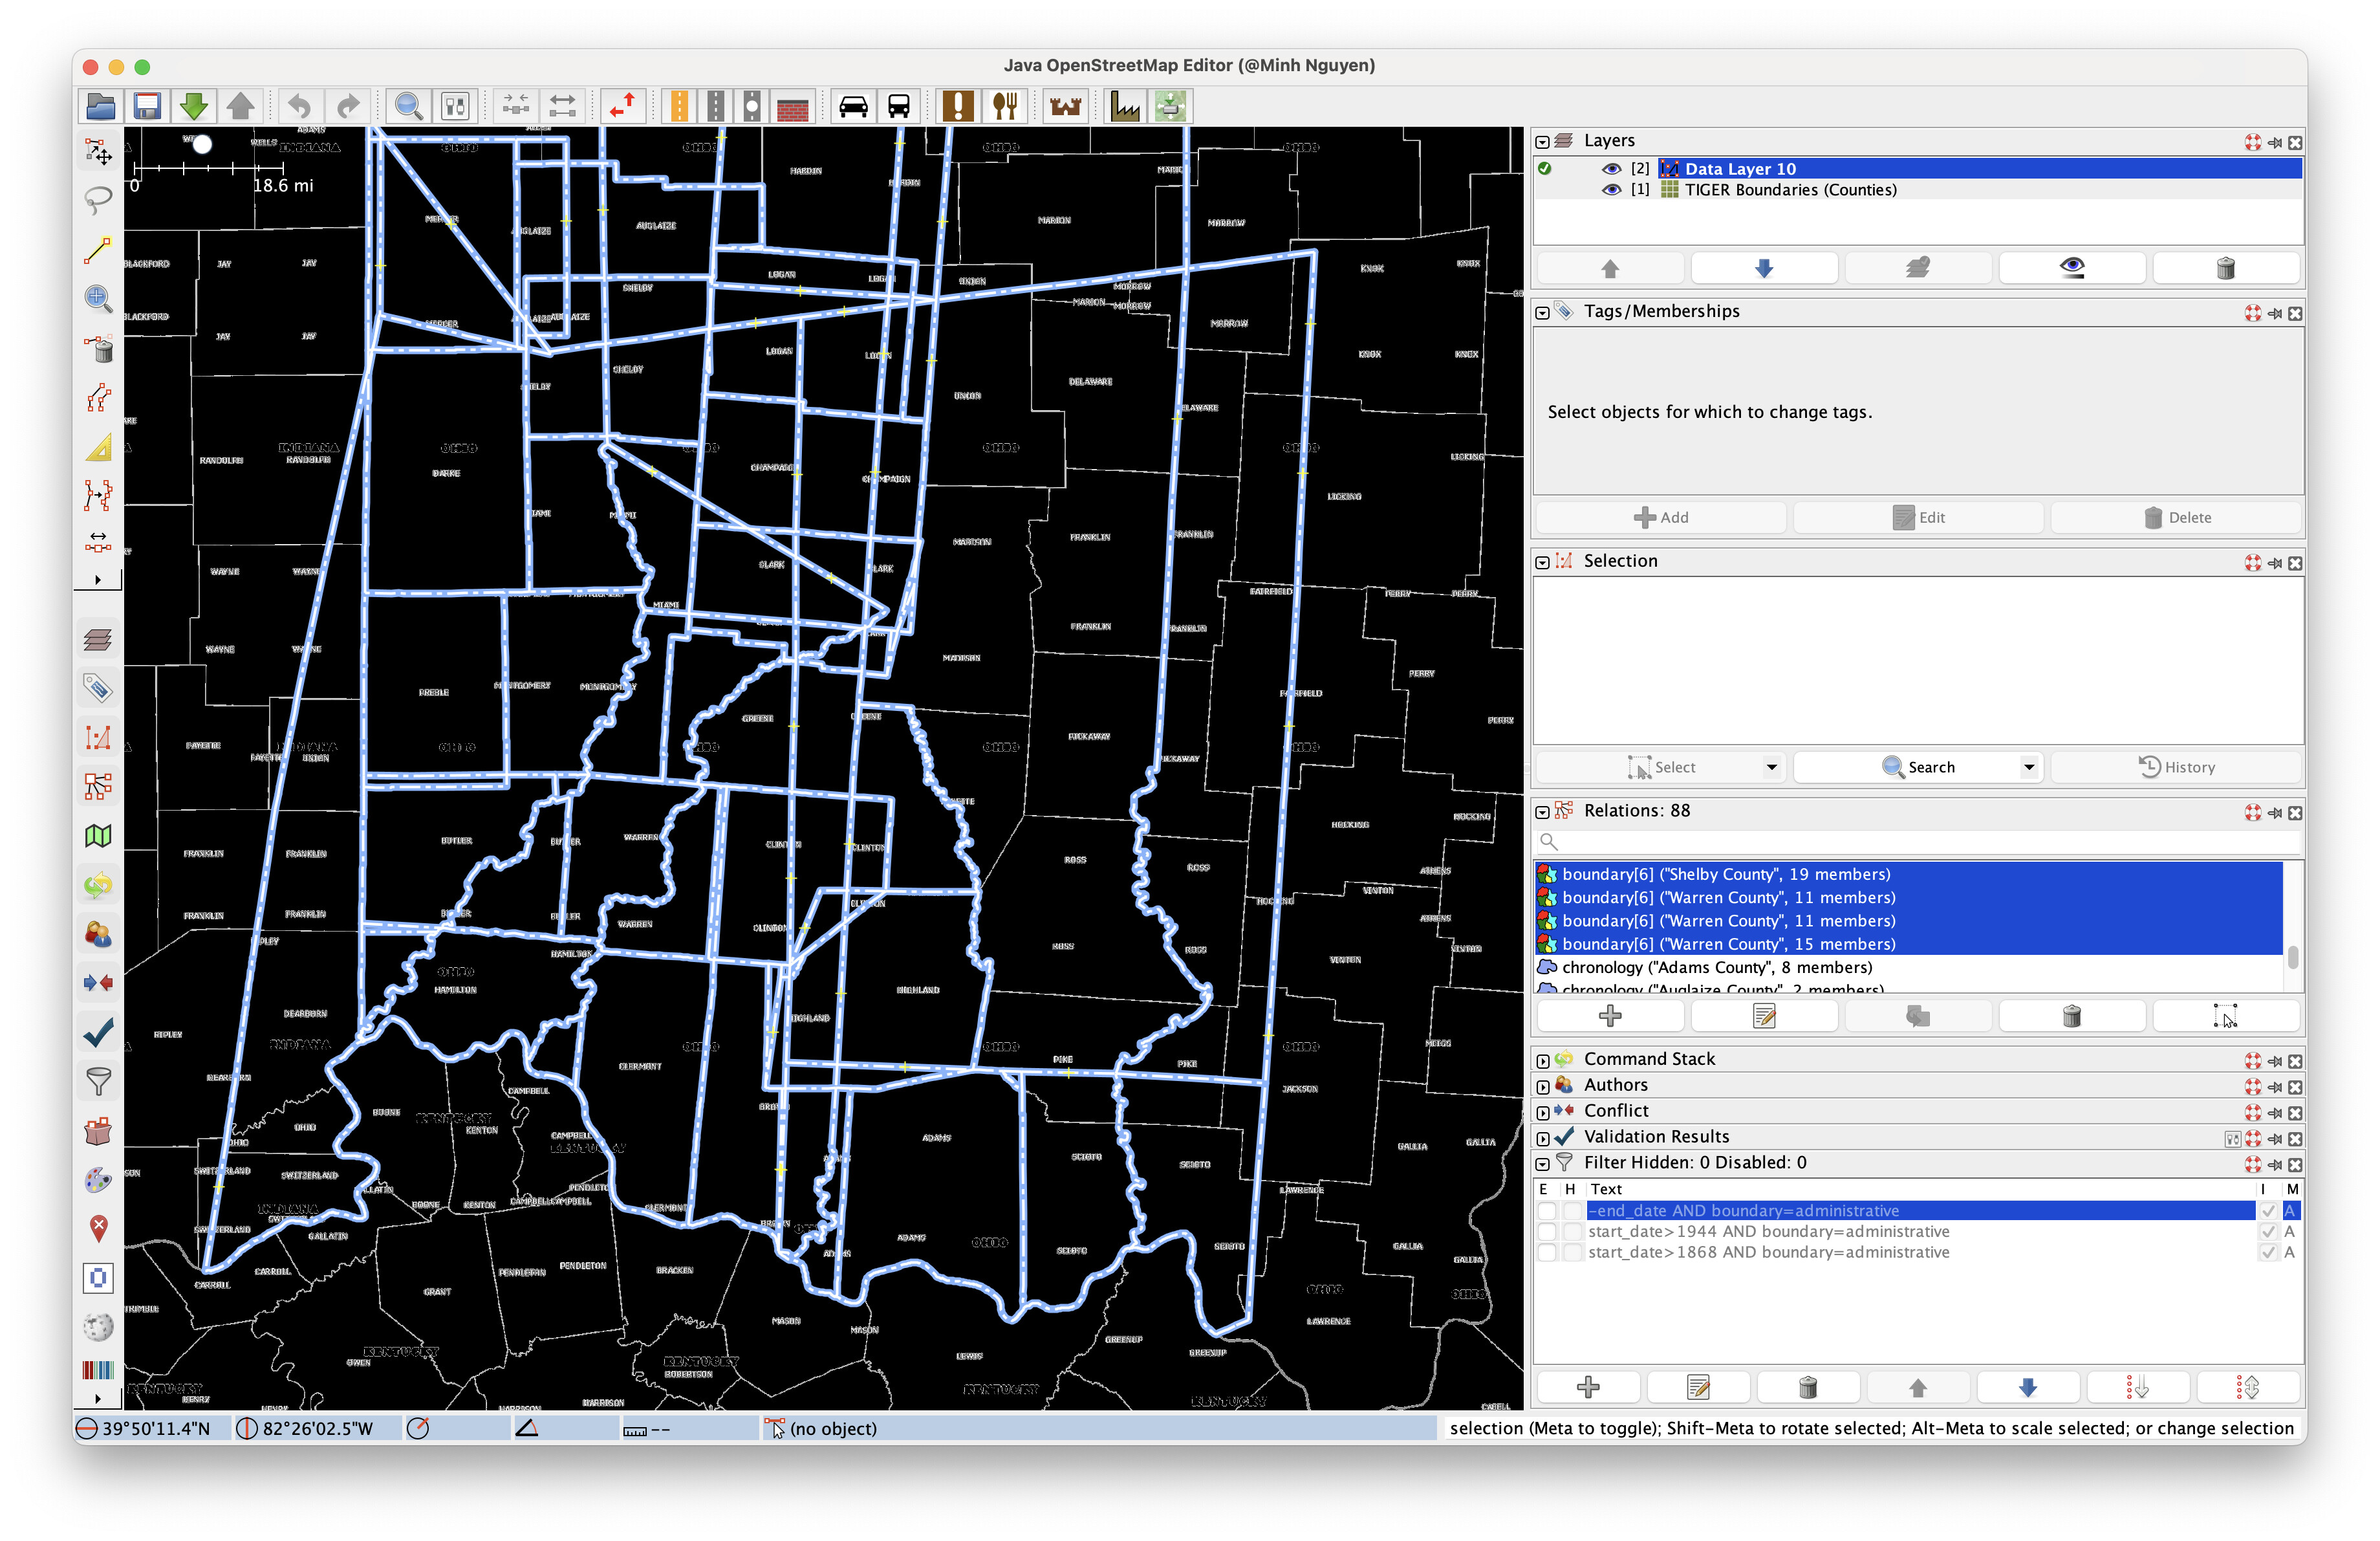
The chronology relations bring in all the counties’ historical boundaries at the same time. To navigate this tangled mess, I added the TIGER county boundary layer as a background layer:
wms:https://tigerweb.geo.census.gov/arcgis/services/TIGERweb/tigerWMS_Current/MapServer/WMSServer?FORMAT=image/png&TRANSPARENT=TRUE&VERSION=1.3.0&SERVICE=WMS&REQUEST=GetMap&LAYERS=12,13,10,11&STYLES=&CRS={proj}&WIDTH={width}&HEIGHT={height}&BBOX={bbox}
and temporarily filtered out all but the current administrative boundaries, then began tracing an outline around the outer counties. You can get by with the built-in filtering functionality, but the ohm-date-filter plugin makes it a lot more convenient.
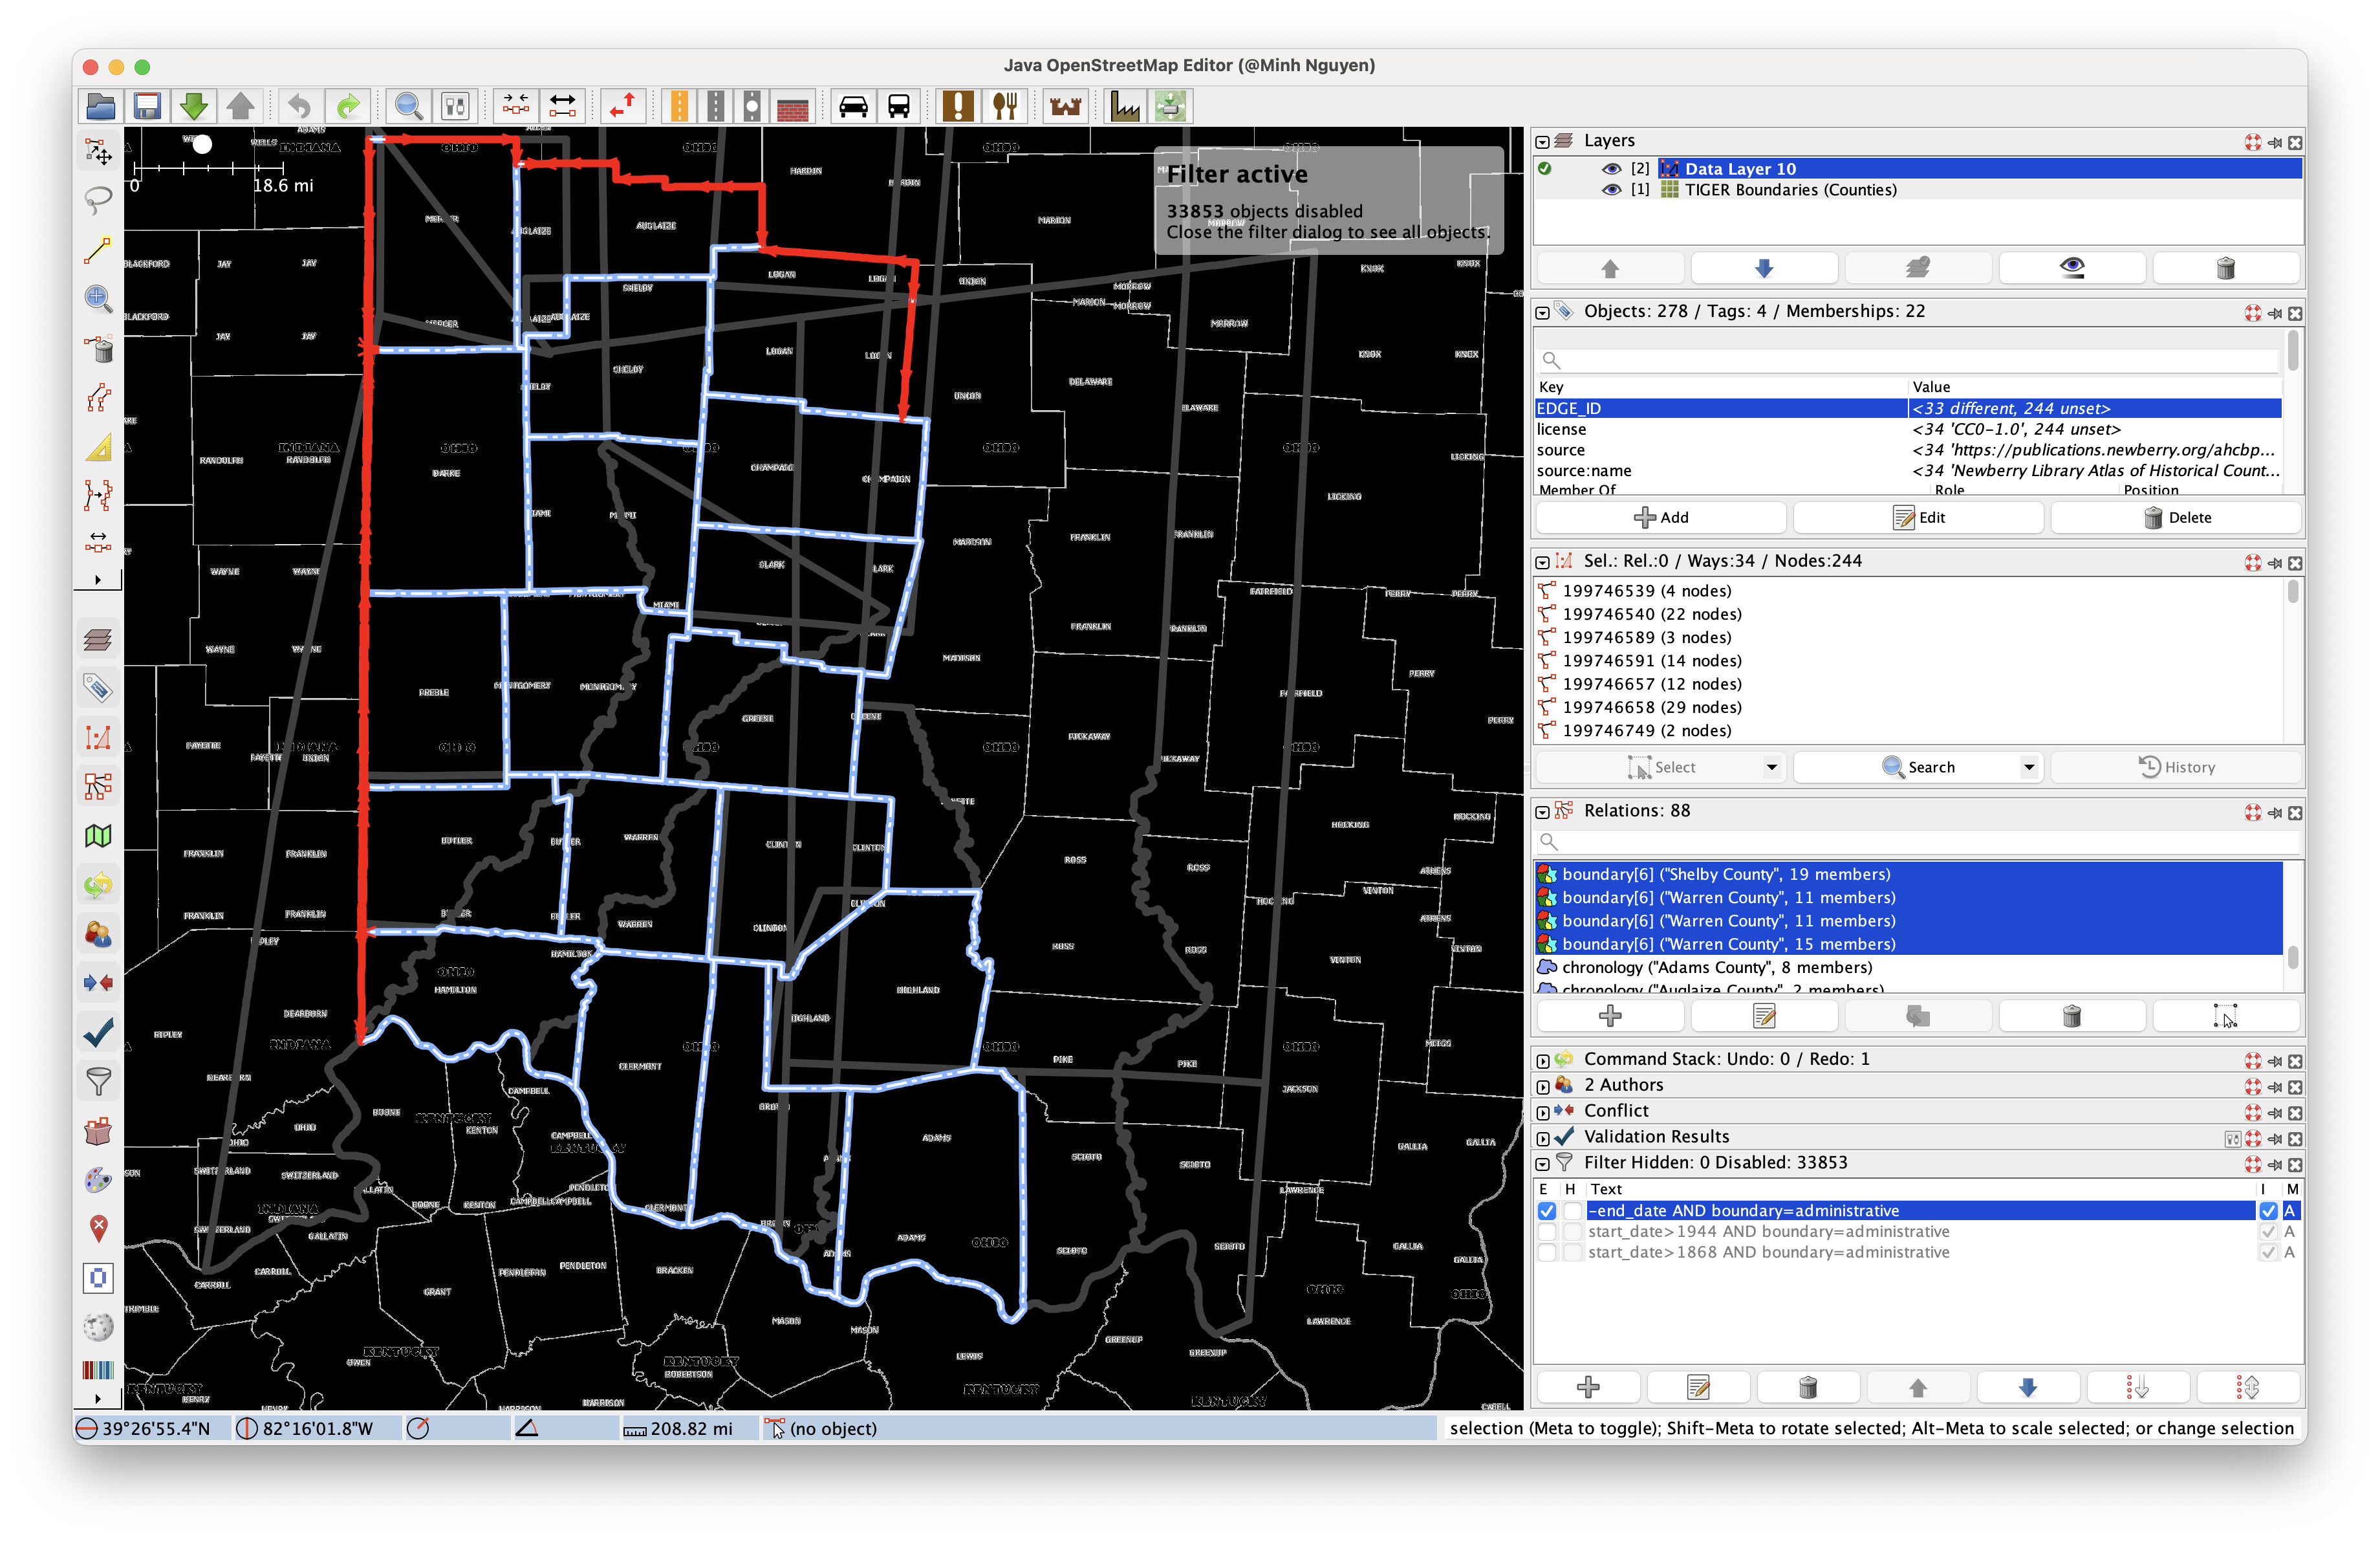
It can be tedious to find and select each of the outer ways one by one. You can select the longer, more prominent ways first, then go back and patch up any gaps indicated in the relation editor:
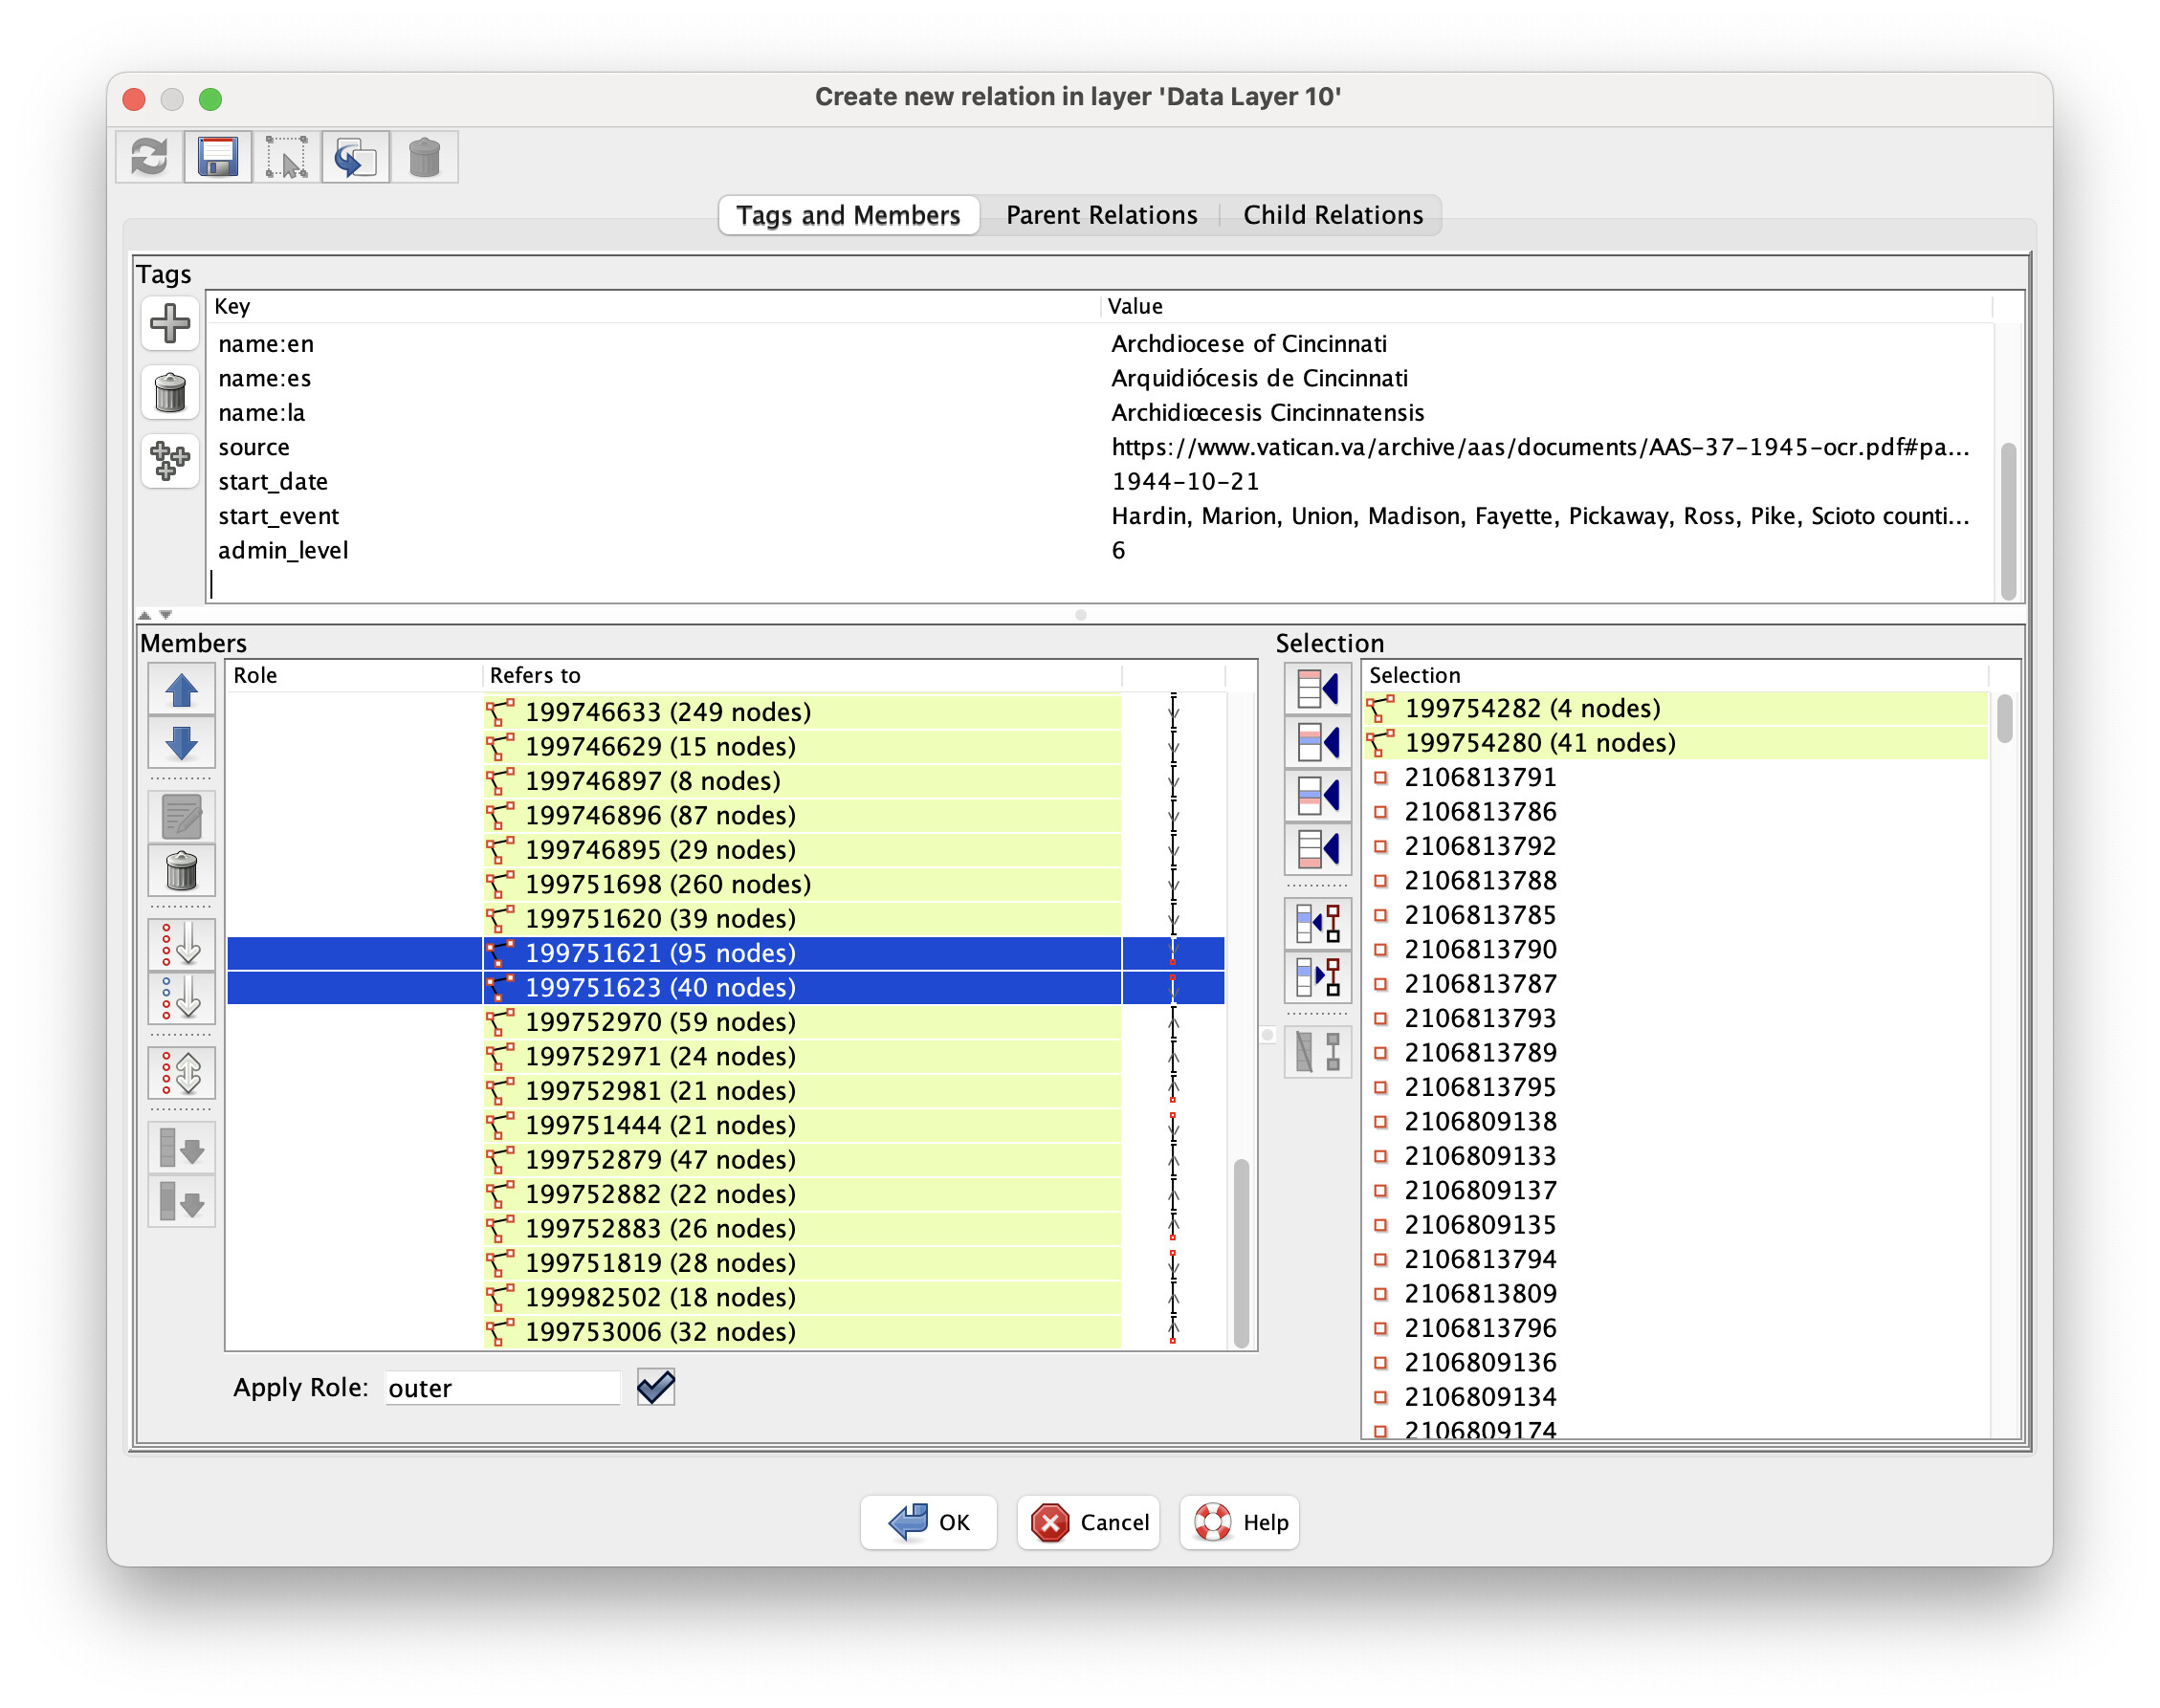
Once I’m done with one boundary relation, I duplicate it, delete the end_date=*, change the start_date=* to an end_date=*, change the start_event=* to describe the previous event, and add the new boundary relation to the chronology relation. Then it’s time to map the geometry of this older stage in the boundary’s evolution. Undo whatever changes the newer boundary describes in start_event=*. This often requires thinking a few steps back: the relation I’m working on may have started due to a very small change, but the rest of the geometry is influenced by some much older change.
Working backwards can be a bit mind-bending. In some cases, you might find it easier to start with the boundary’s establishment and work your way forward. But the tradeoff is that early history can be murky, so you might have to occasionally return to an earlier boundary to adjust something that only becomes clearer in later stages. I tend to work backwards because it’s easier to find detailed sources about the present. Either way, keep a list somewhere of the changes you want to map in chronological order, so that you can quickly remind yourself of key facts if you accidentally get lost or confused.
The changeset ended up touching a lot of boundaries, but this is normal in OHM. Just make sure you use the “Download parent ways/relations” command and download the members of incomplete relations before splitting anything. This avoids mangling other relations that happen to include the way you’re splitting.
Sight unseen
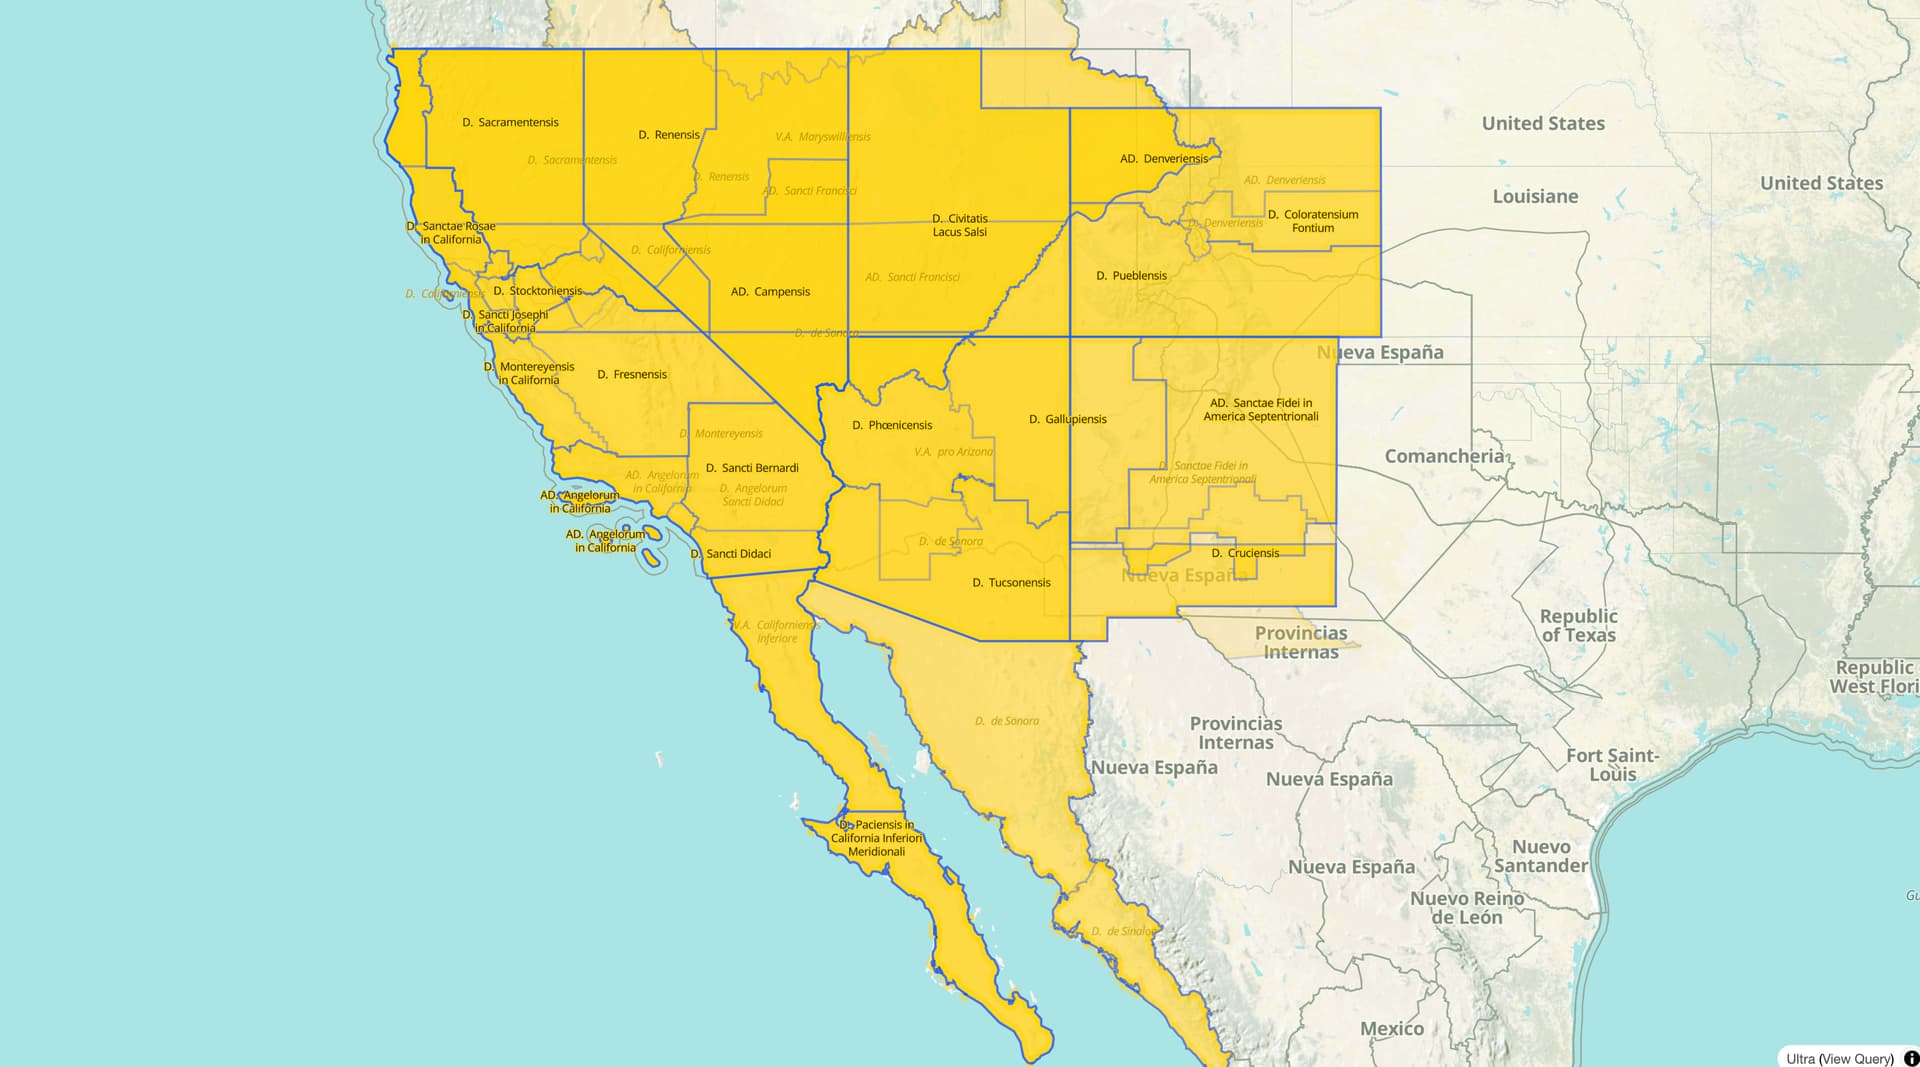
After a few hours of research and mapping, I wanted to visualize the archdiocese’s territorial evolution to share it with you. Unfortunately, our vector tiles only include general-audience features like civil administrative boundaries. Fortunately, I can easily query Overpass for geometries of all the boundary relations in the chronology relation and export them as GeoJSON. From there, I followed our guide to making a time series animation in QGIS, including a date label that makes the animation easier to understand.
Boundary animations work best against a simpler backdrop than our busy Historical style. The archdiocesan boundary has historically mostly followed county lines, so it’s easier to understand the changes when comparing them to that layer. I could’ve brought in a standard layer of modern-day county lines, but I think it’s interesting to see how the ecclesiastical boundaries evolved at the same time that the civil boundaries also evolved.
As a shortcut, I pulled in the American Historical County Boundary shapefile for Ohio. This is from the same dataset of county lines that we imported last year. I could’ve instead queried Overpass for our coverage of county lines, but I would’ve needed to perform some extra steps in QGIS to subtract Lake Erie from the northern counties. In some other states, that might be necessary to address some discrepancies in the AHCB that are noticeable at this scale.
Just the beginning
There’s plenty more to do from this point. We have St. Peter in Chains Cathedral in Cincinnati, but not St. Monica Church, which was the cathedral during the 1940s and ’50s. The Cincinnati diocese’s predecessors, the Dioceses of Bardstown, Baltimore, and Québec, would be major undertakings on the scale of country boundaries. These days, I live in a diocese descended from a briefly transnational diocese, which would be interesting to visualize. Maybe we could get our hands on information about boundaries at other levels of the ecclesiastical hierarchy, like deaneries and parishes, or the provinces of religious orders. Finally, other denominations and religions also have ecclesiastical boundaries that often follow the very same civil boundaries.
I hope those who come to OSM looking for ecclesiastical boundaries will end up with more than they bargained for in OHM. We’ll need all the help we can get to get even minimal coverage of diocesan boundaries. Not everyone will be interested in learning about these boundaries, let alone mapping them. That’s perfectly OK, but at least we can provide an outlet for those who are interested, so that the conversation doesn’t have to end with “out of scope”.