Agree totally Jeff. Waterways often very visibly embody the relationship between humans and the land and that is something that interests me. And the changes are visible at very large scales! The waterways also map one edge of a settlement and the centre of activity - especially harbours and ports - so they are pretty foundational to all the other mapping activities and important to get correct.
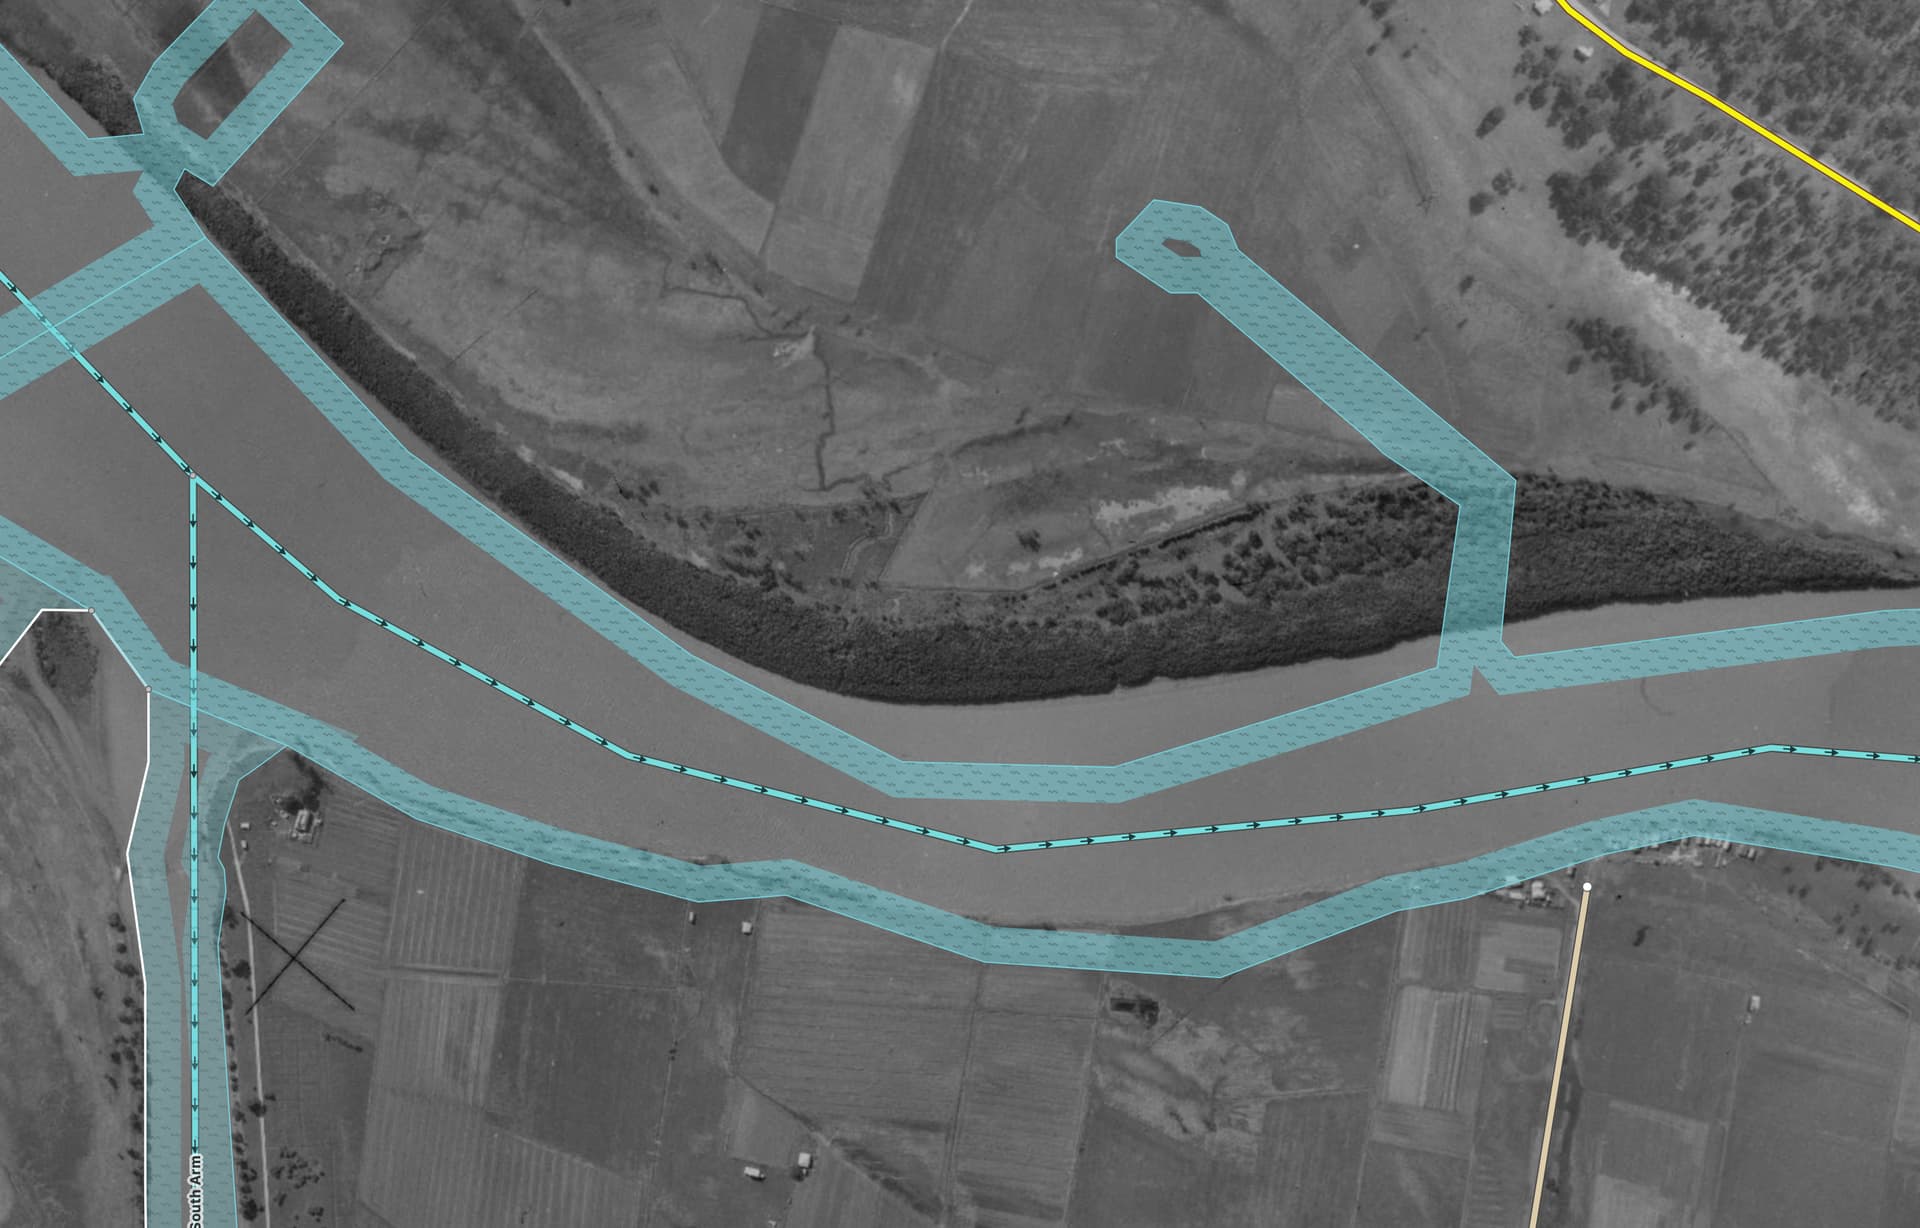
Getting it correct is complex though and I would like to see a ‘best practice’ developed for waterways that takes into account the current OHM capabilities and where future development might head. I have mostly been following the advice of @Minh_Nguyen and breaking the area I am working on into segments and this is best explained with a screenshot.
This is one river segment and consists of a multipolygon relation of natural=water; water=river and this one represents the ‘original’ river prior to settlement (I haven’t tried this as a waterway relation, maybe it works the same). I used an end_date of 1878, this being the start of major river shoreline changes, but the segment is predominantly based on an amalgam of a 1944 aerial image and earlier maps of smaller scope and accuracy. The 15 km of river I am mapping is divided into a total of 11 segments that meet at straight line boundaries crossing the river. The segment shown in the image is actually subdivided into 2 segments after 1920 (when the central land was created) for ease of mapping all the changes where the ships are visible in the image.
Each river segment has a sequence of temporal ‘variants’ that line up with the existence of reliable large scale maps, subject to the frequency of changes of the shoreline. A couple of segments in the upper reaches of the river have only two temporal variants, largely because there was very little change over time. Some segments for the lower reaches around the harbour may have 4 or more temporal variants.
Around the shoreline of some segments there might be 10 or more mapped changes on different dates affecting a small part of the shoreline and rather than creating a new temporal segment for every change I have adopted the following approach:
- the temporal range for a temporal variant starts in the year following the previously available map of that segment (ie after the previous temporal variant) and ends in the year of the map that defines the segment shoreline (ie before the next temporal variant).
- In OHM I can’t see how to add land to a water area over time, but only how to subtract or add water. Therefore each area of land that will be ‘added’ during the time range of a temporal variant is included as a water polygon with an end-date equal to the date the land was added (and a start date equal to the temporal variants start date). Land that will be ‘lost’ during the temporal range is included as a water polygon with a start_date equal to the date the land was lost (and an end date equal to the temporal variant’s end date). This is my solution to the problem that @Bauer33333 highlighted and sometimes I have even added polygons that interpolate between dates if I have supporting non-mapping evidence. These polygons are not members of the segment’s multipolygon relation as they would breach the single temporal range requirement.
Note that the time range for the temporal variants within each river segment don’t align with other segments and I think this means that the chronology relation can’t be applied to the entire river as that relation prohibits overlapping temporal ranges (?).
The only alternatives I see to my approach are:
a) every change to the shoreline, no matter how minor, requires a completely new segment temporal variant to be created, or
b) the segment (or even the entire river) could be mapped as multipolygon relations with every change requiring a new relation and unchanged shoreline parts shared across relations. This would mean that every map used would be associated with a new relation (if the date was unique). This would be extremely complex to manage and difficult for future editors to maintain (or even interpret).
I think my approach is some form of hybrid, but maybe I have got it all wrong and there is a much simpler way. Please let me know!
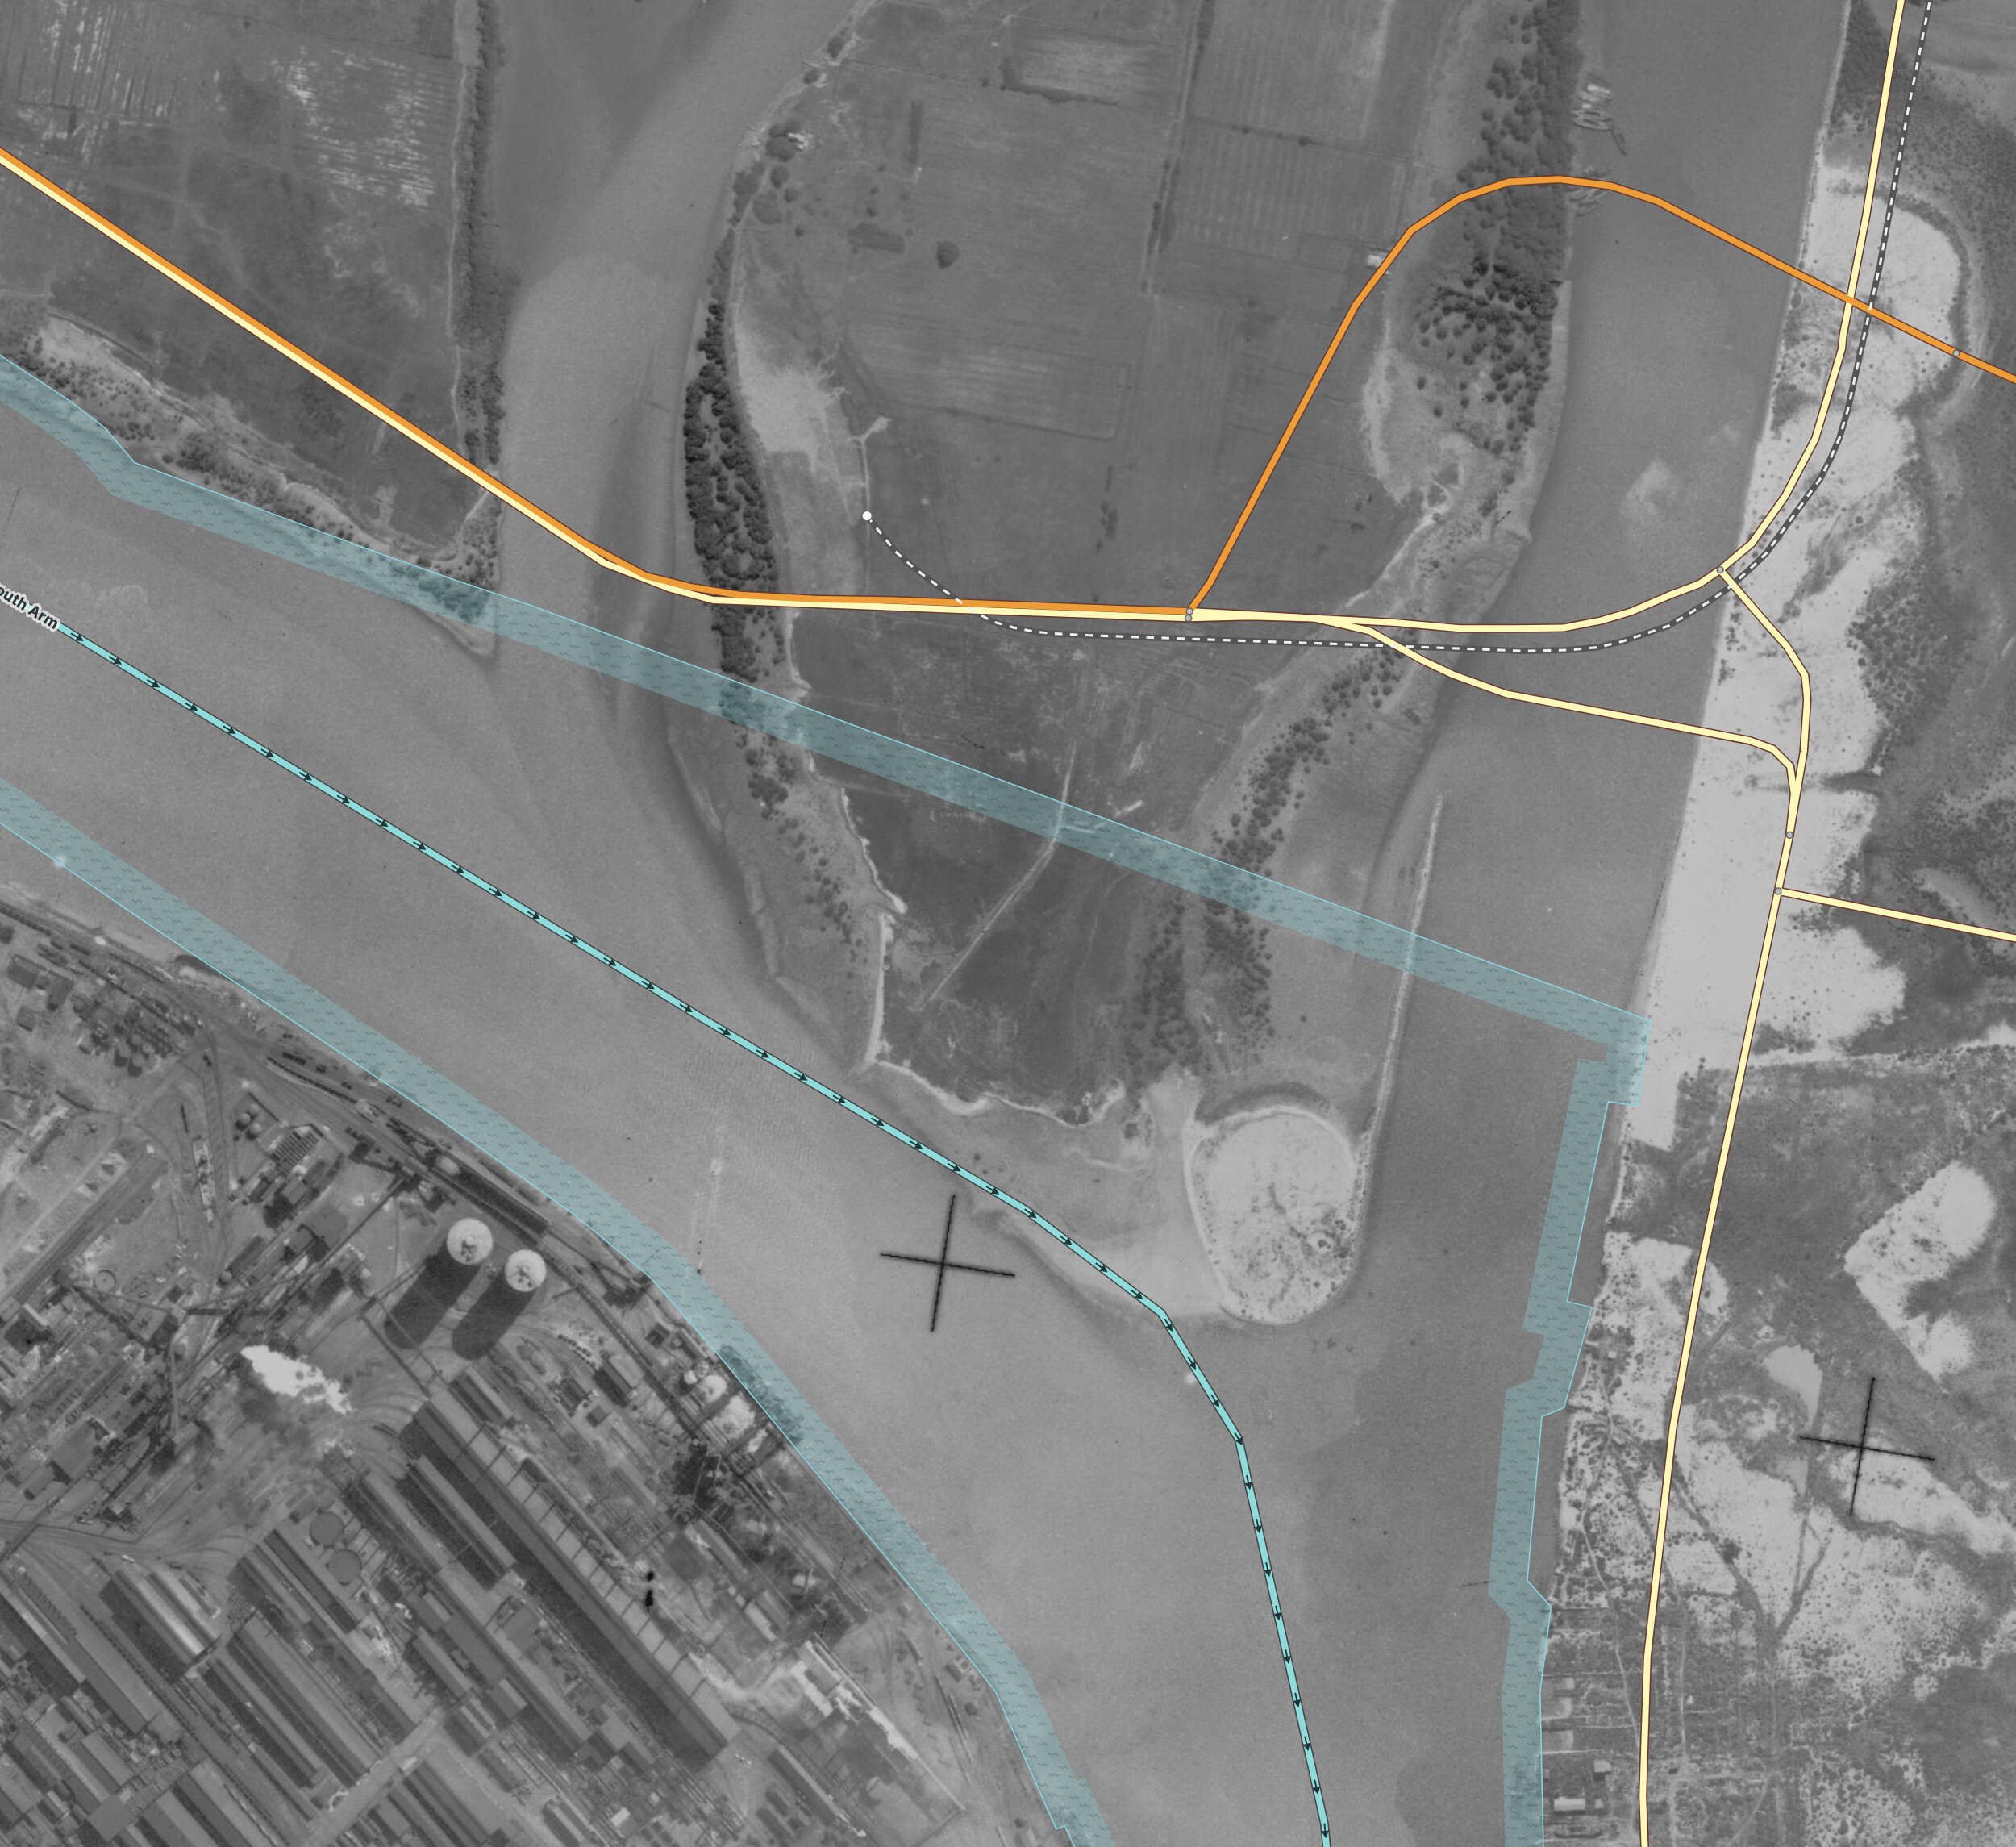
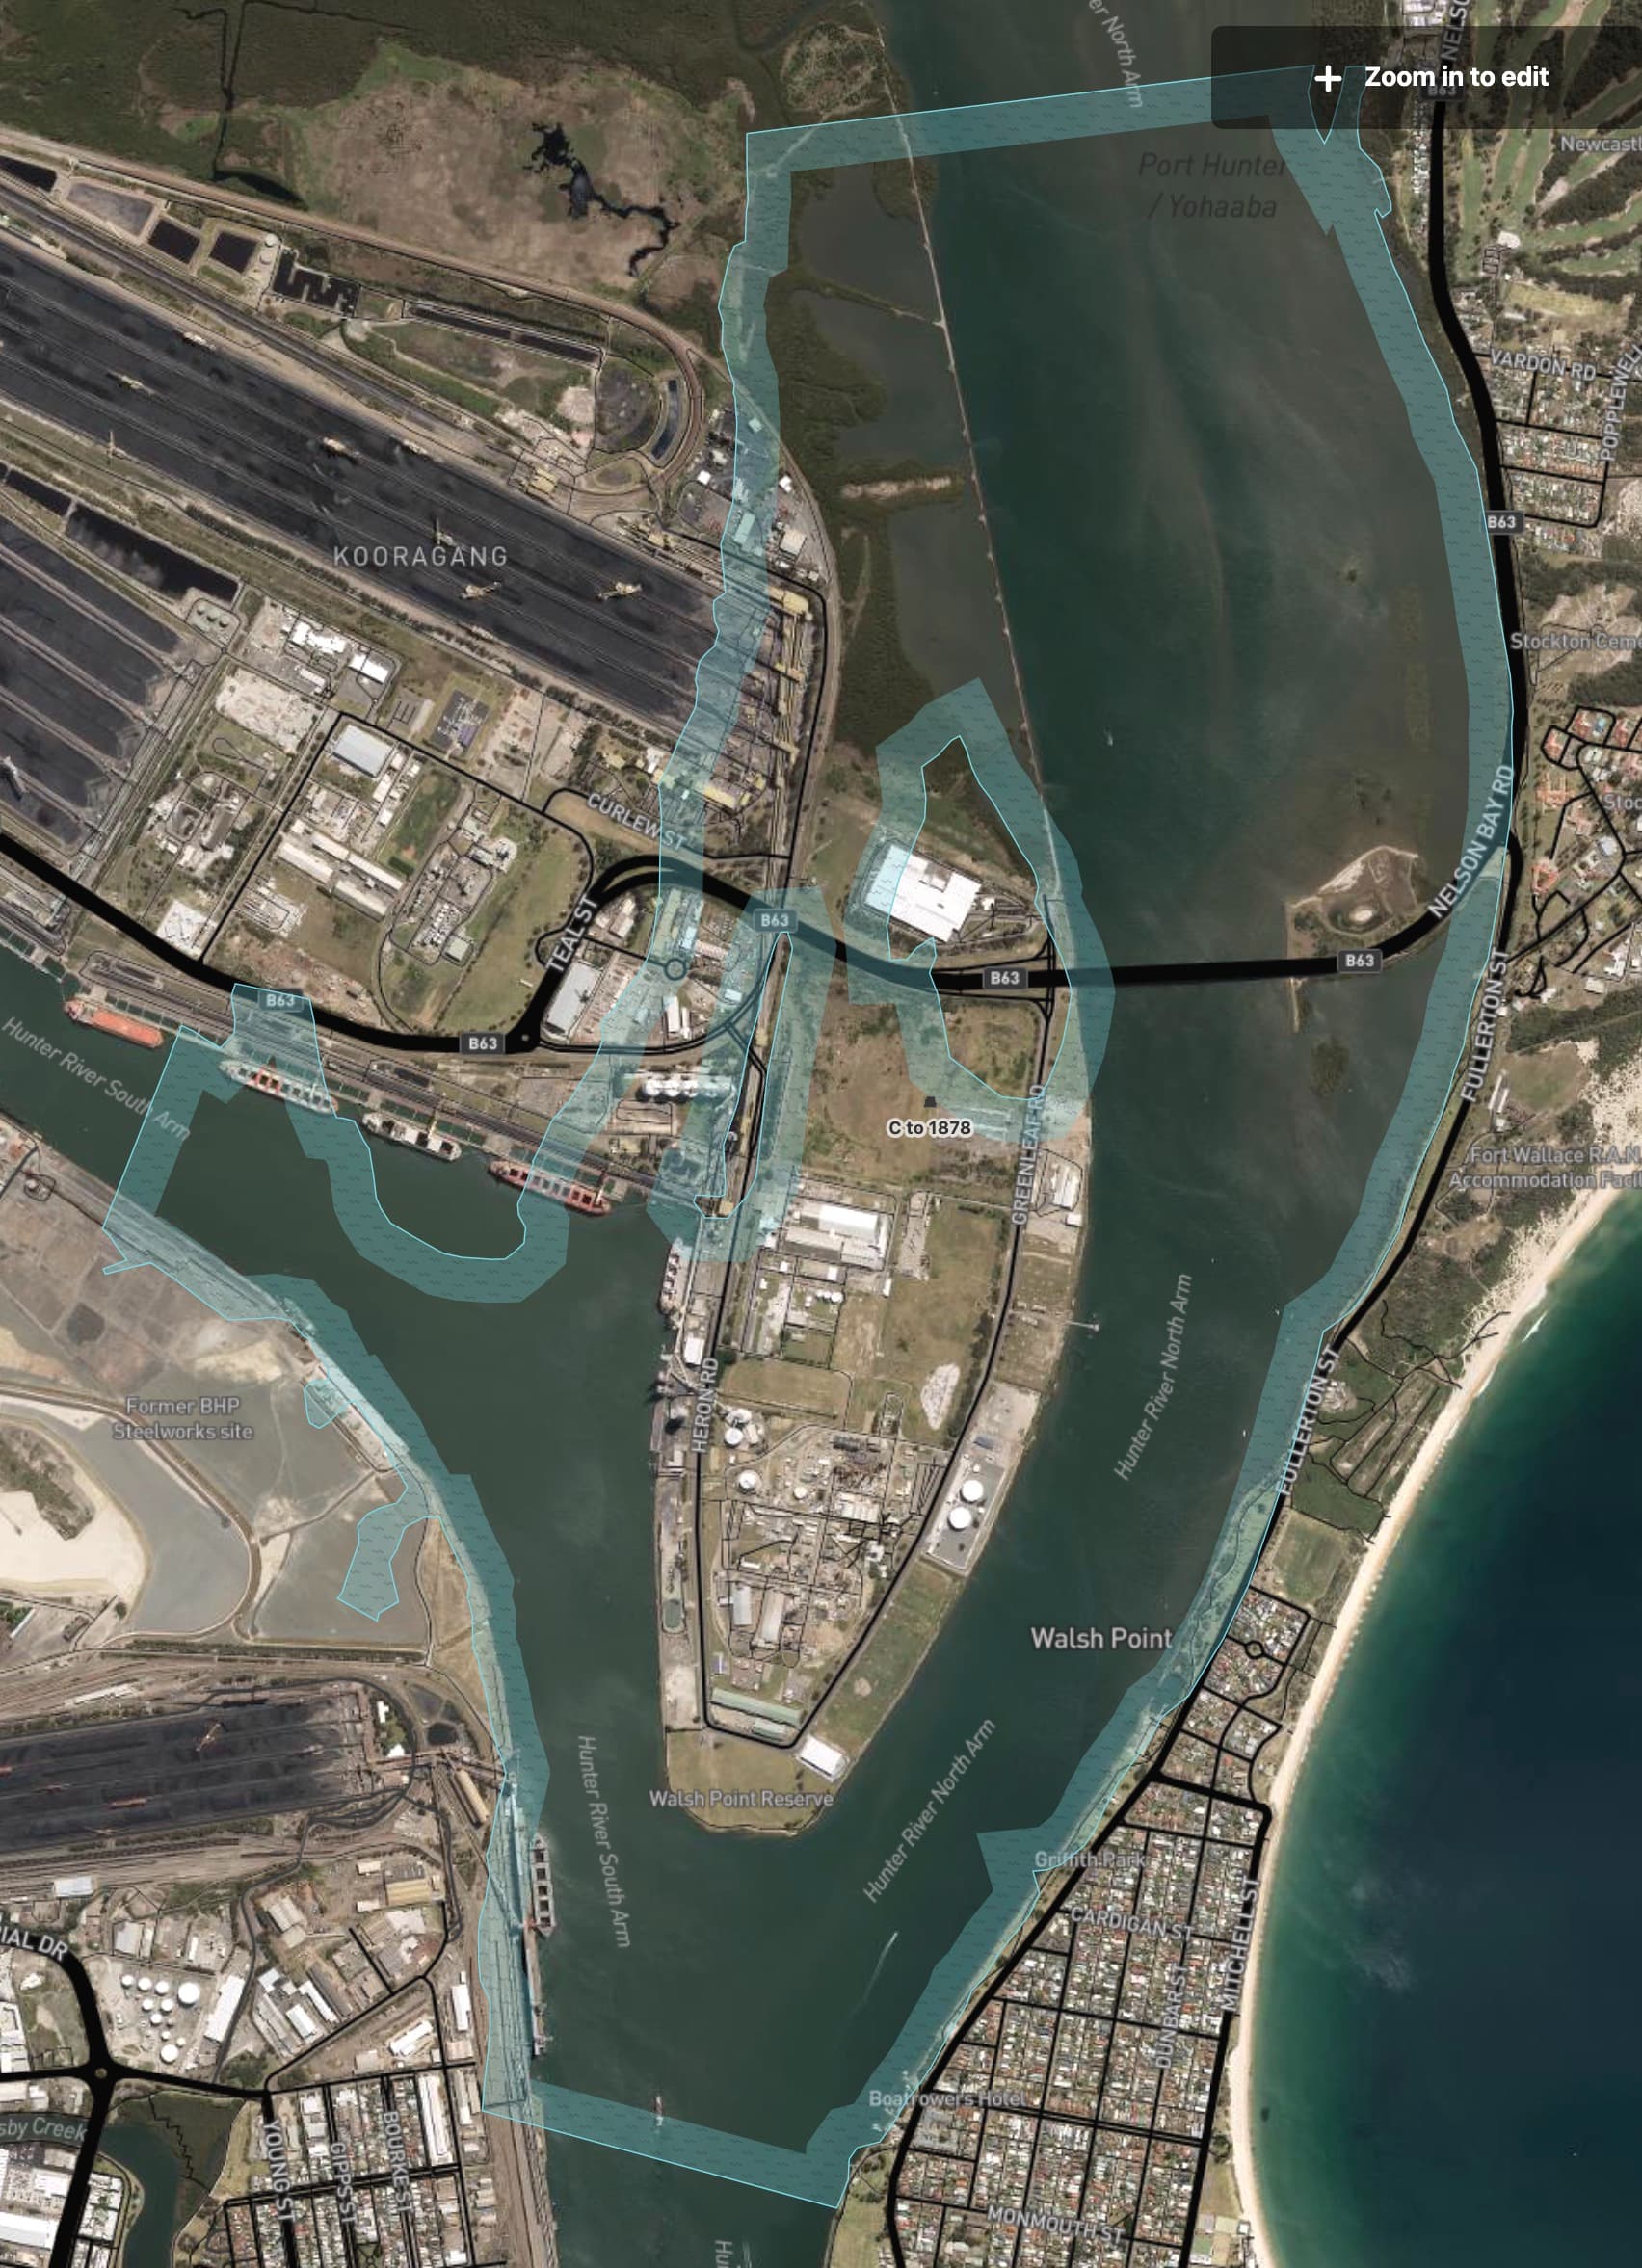
The area is here and I haven’t completed the mapping yet, especially around the southern shoreline and the harbour mouth. Some of these areas reflect a previous strategy and need to be fixed. It is actually doing my head in trying to integrate all the various cartographic sources  OpenHistoricalMap