I’m working my way through updating all of the US states’ boundaries with their county boundaries and this has triggered the question for me of why OSM features and treats territorial waters so prominently - both on the map and in the data, and whether or not OHM should follow this lead.
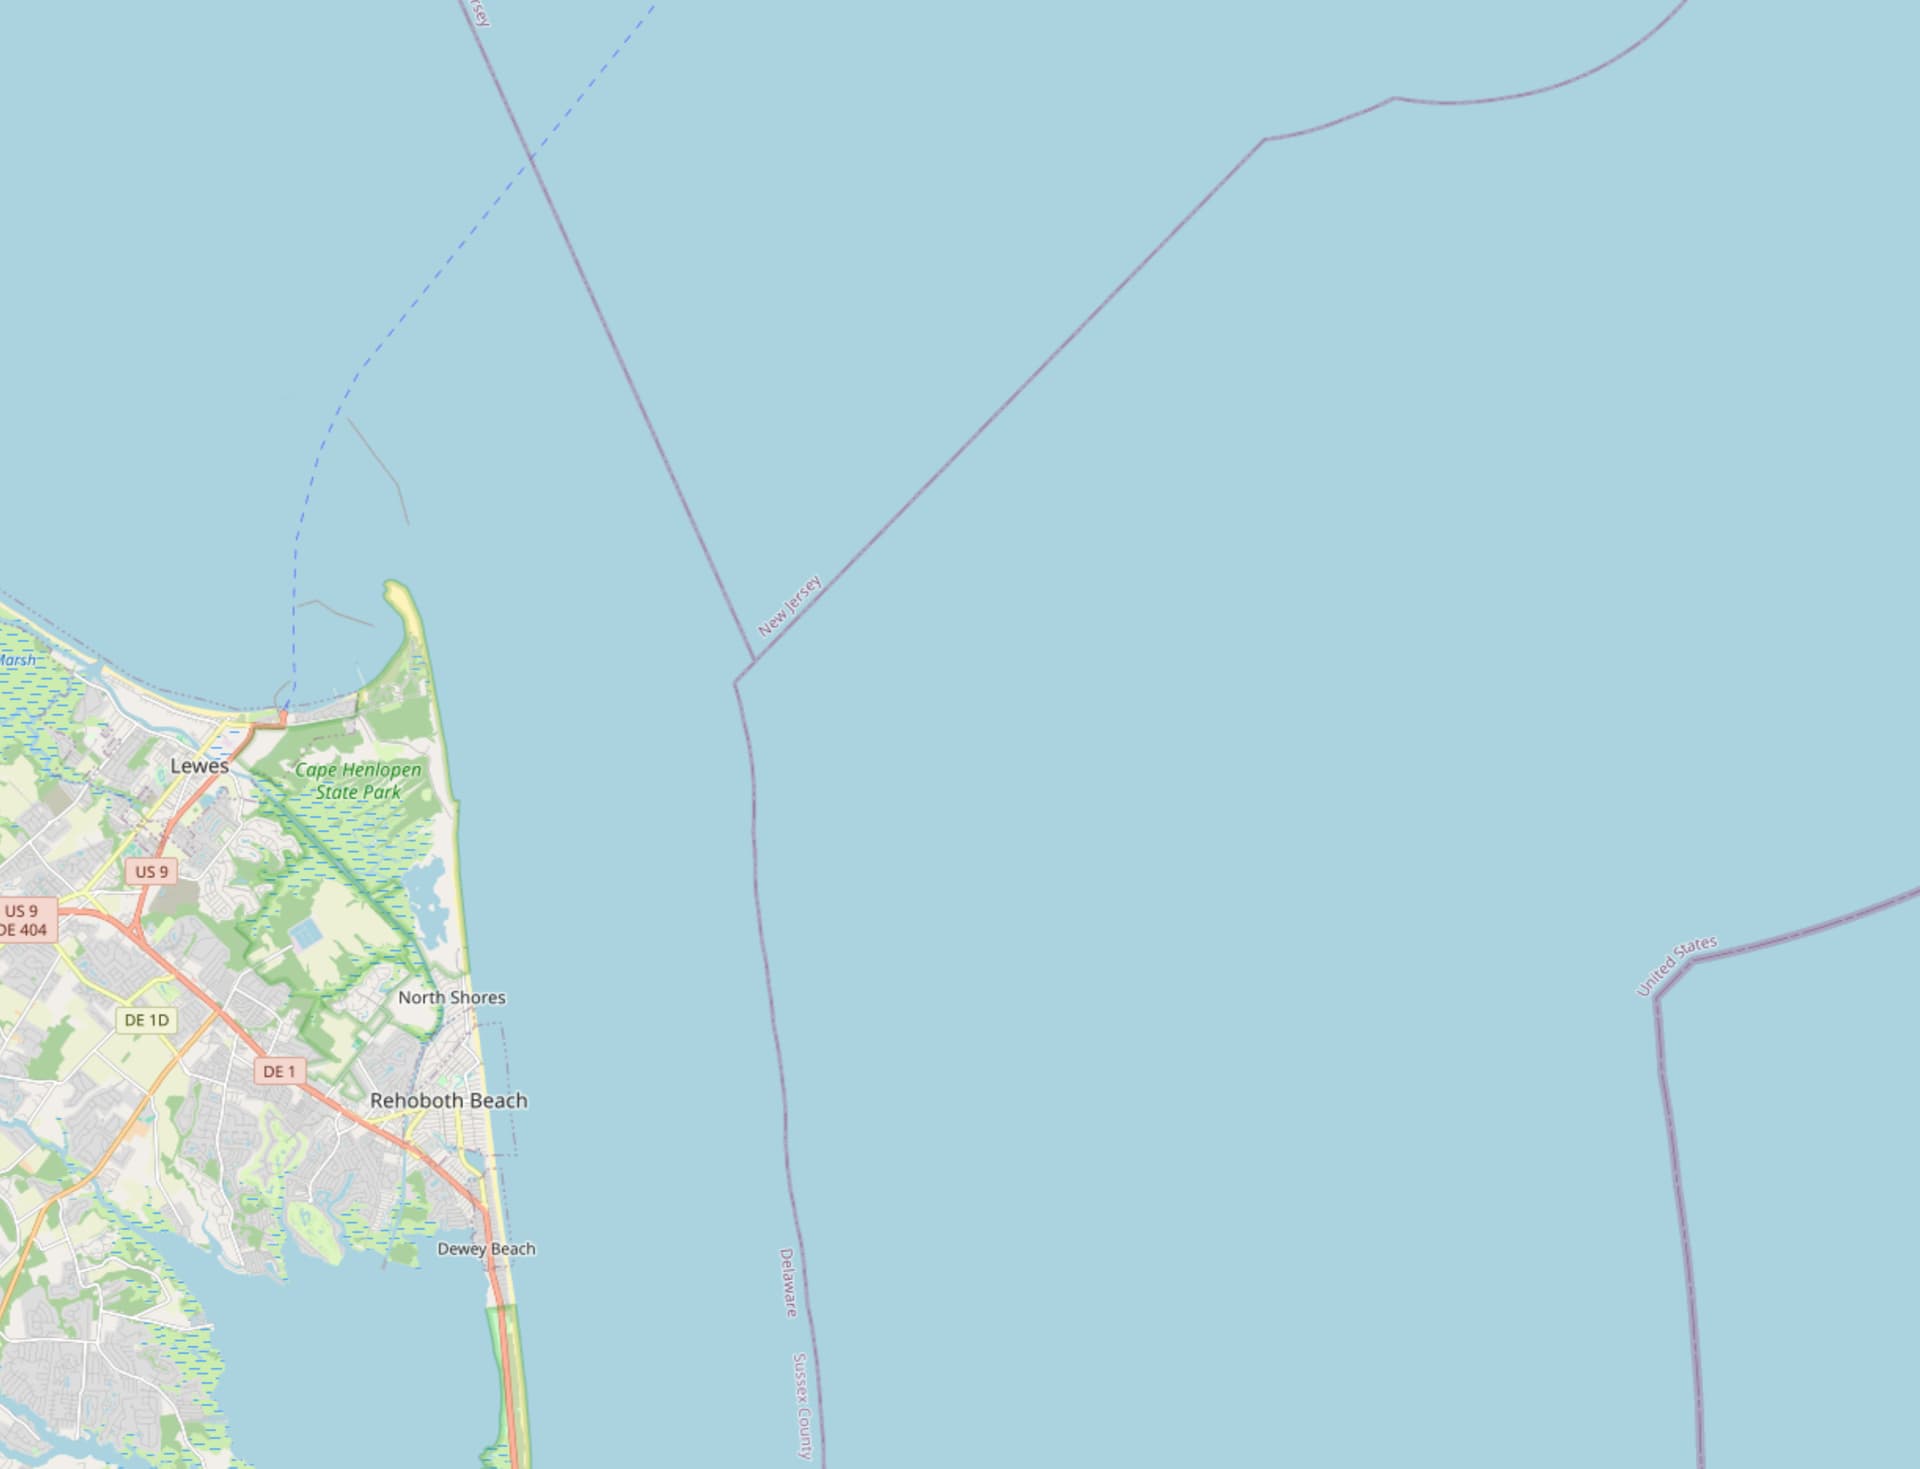
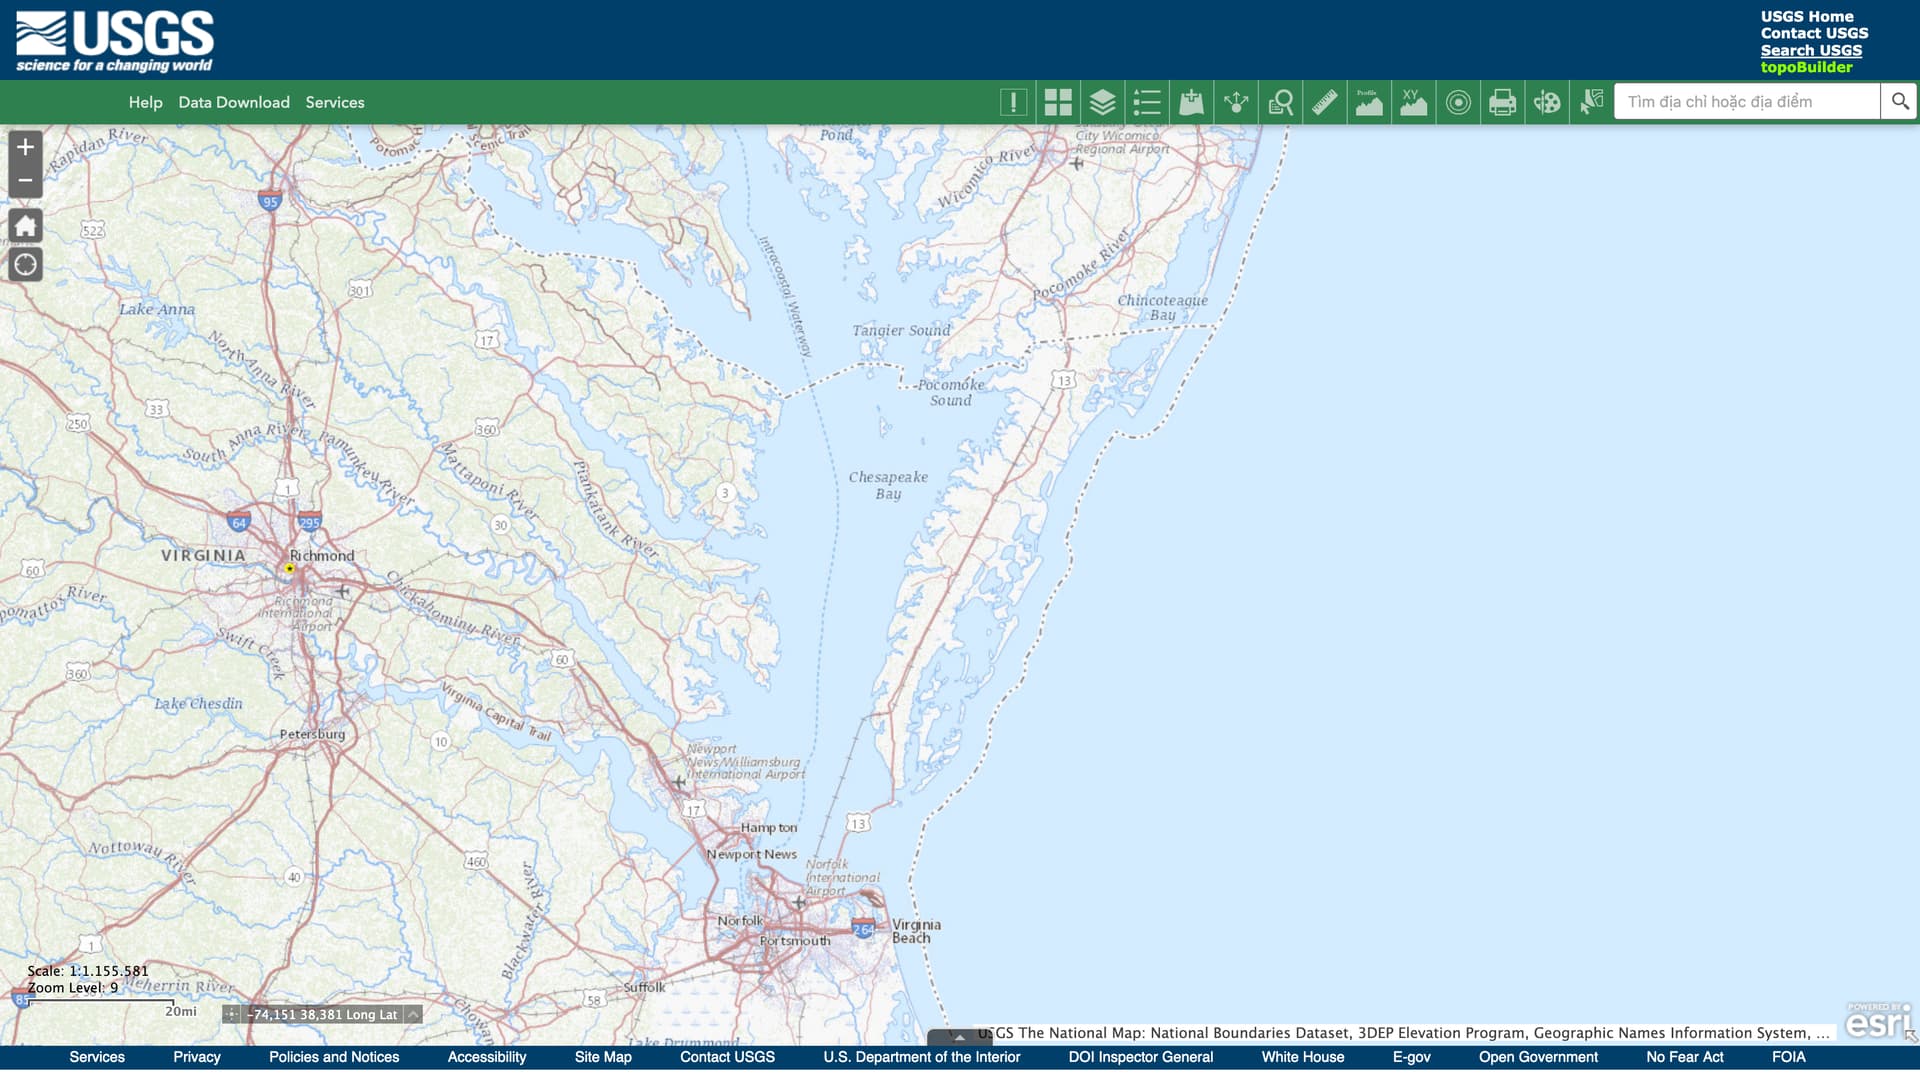
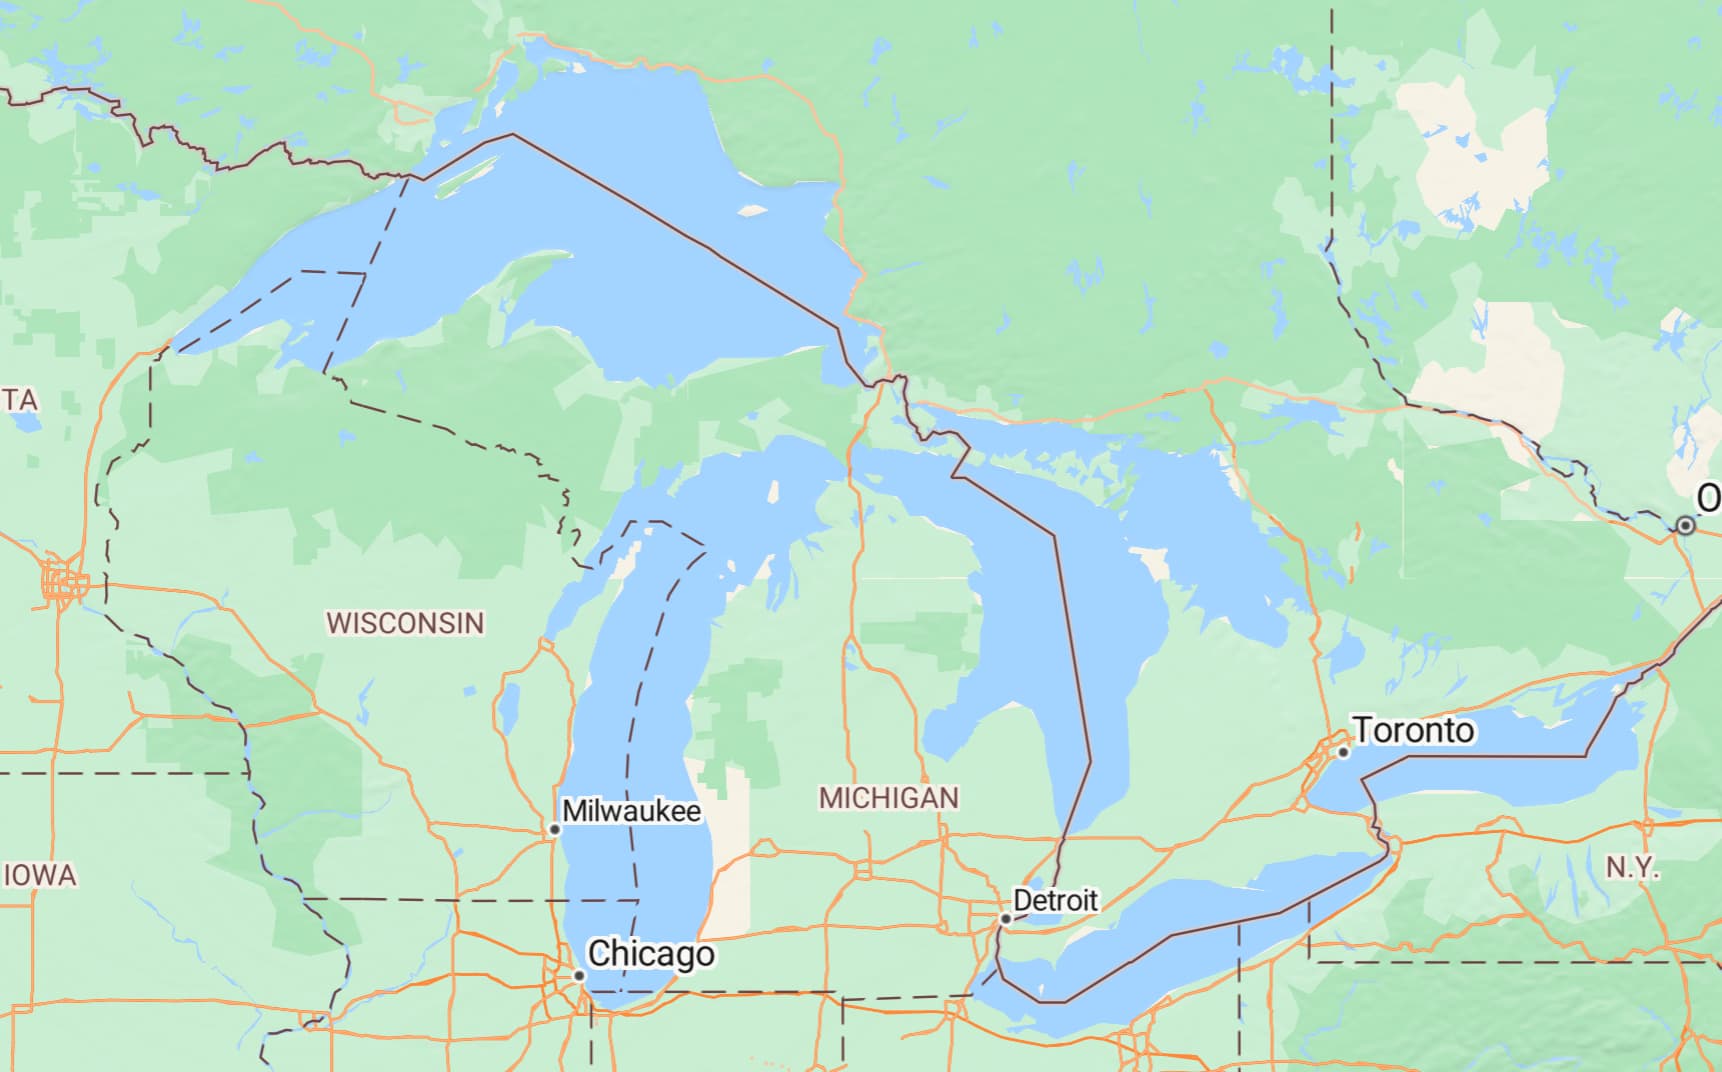
For example, OSM on the map, off the Delaware / New Jersey border shoreline:
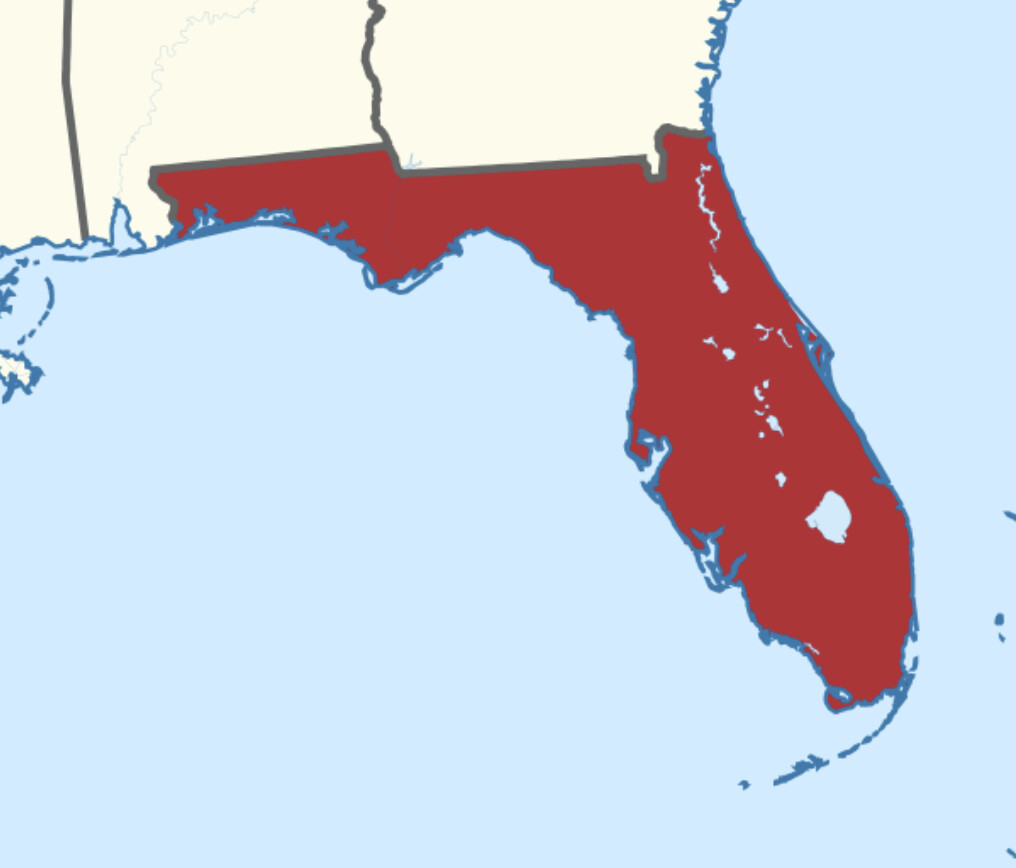
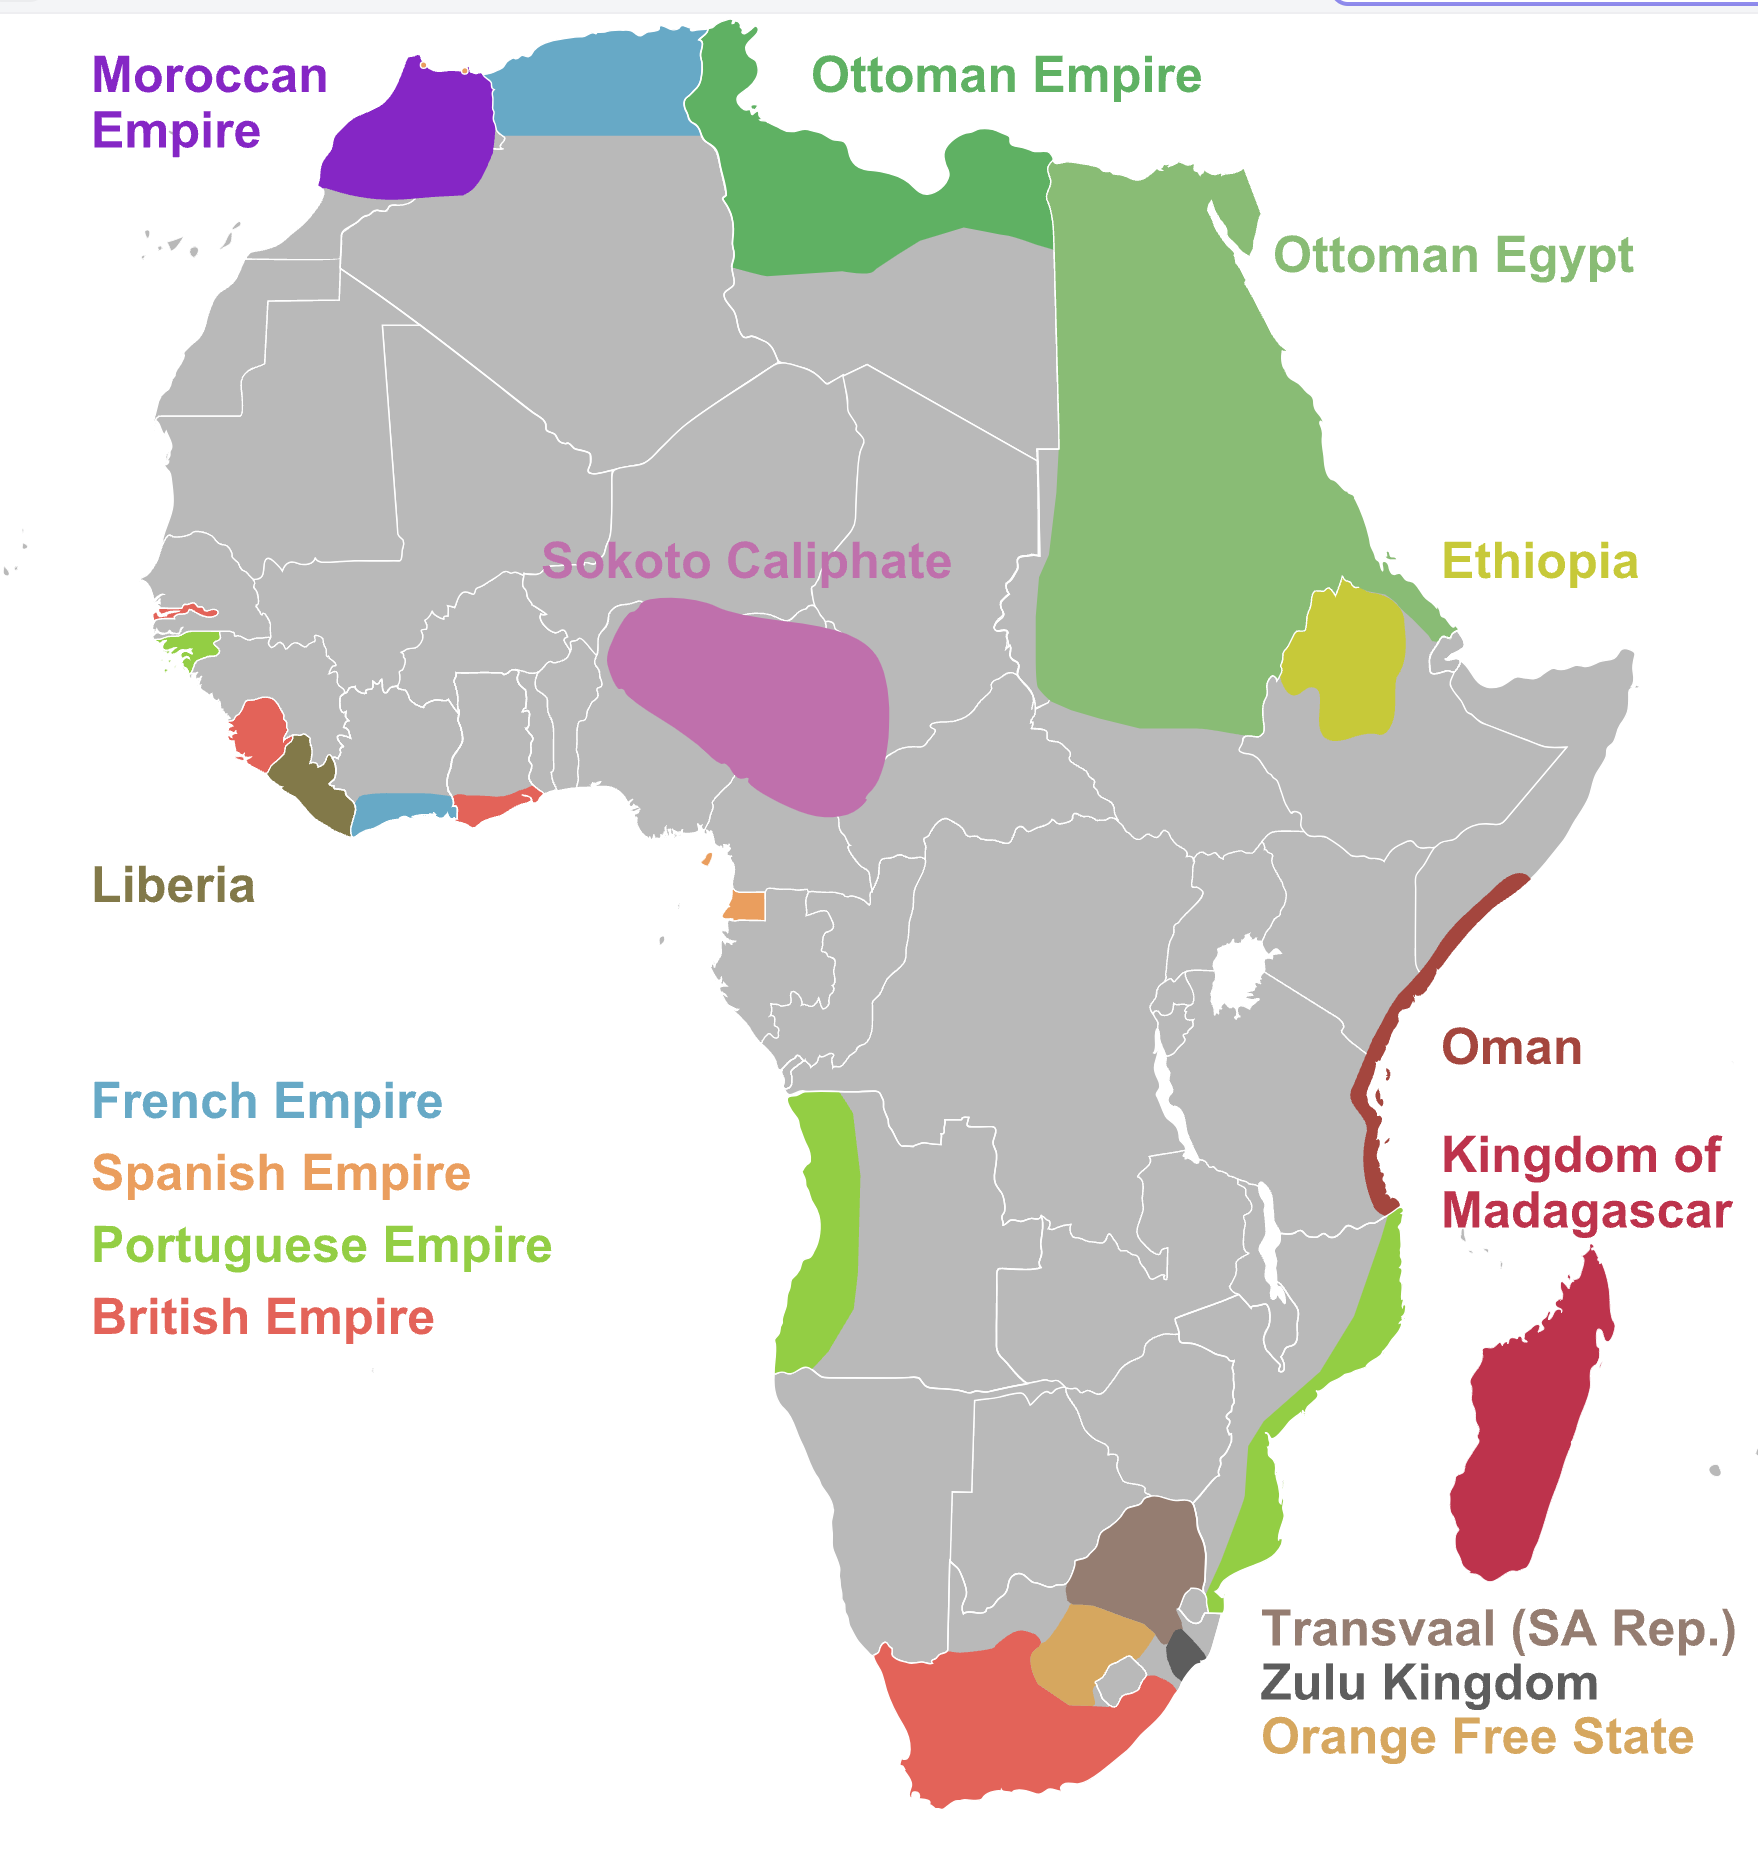
I get that including these territorial waters in the boundaries is technically correct, but including water isn’t what (I think) most people imagine when they think of a state or country’s shape.
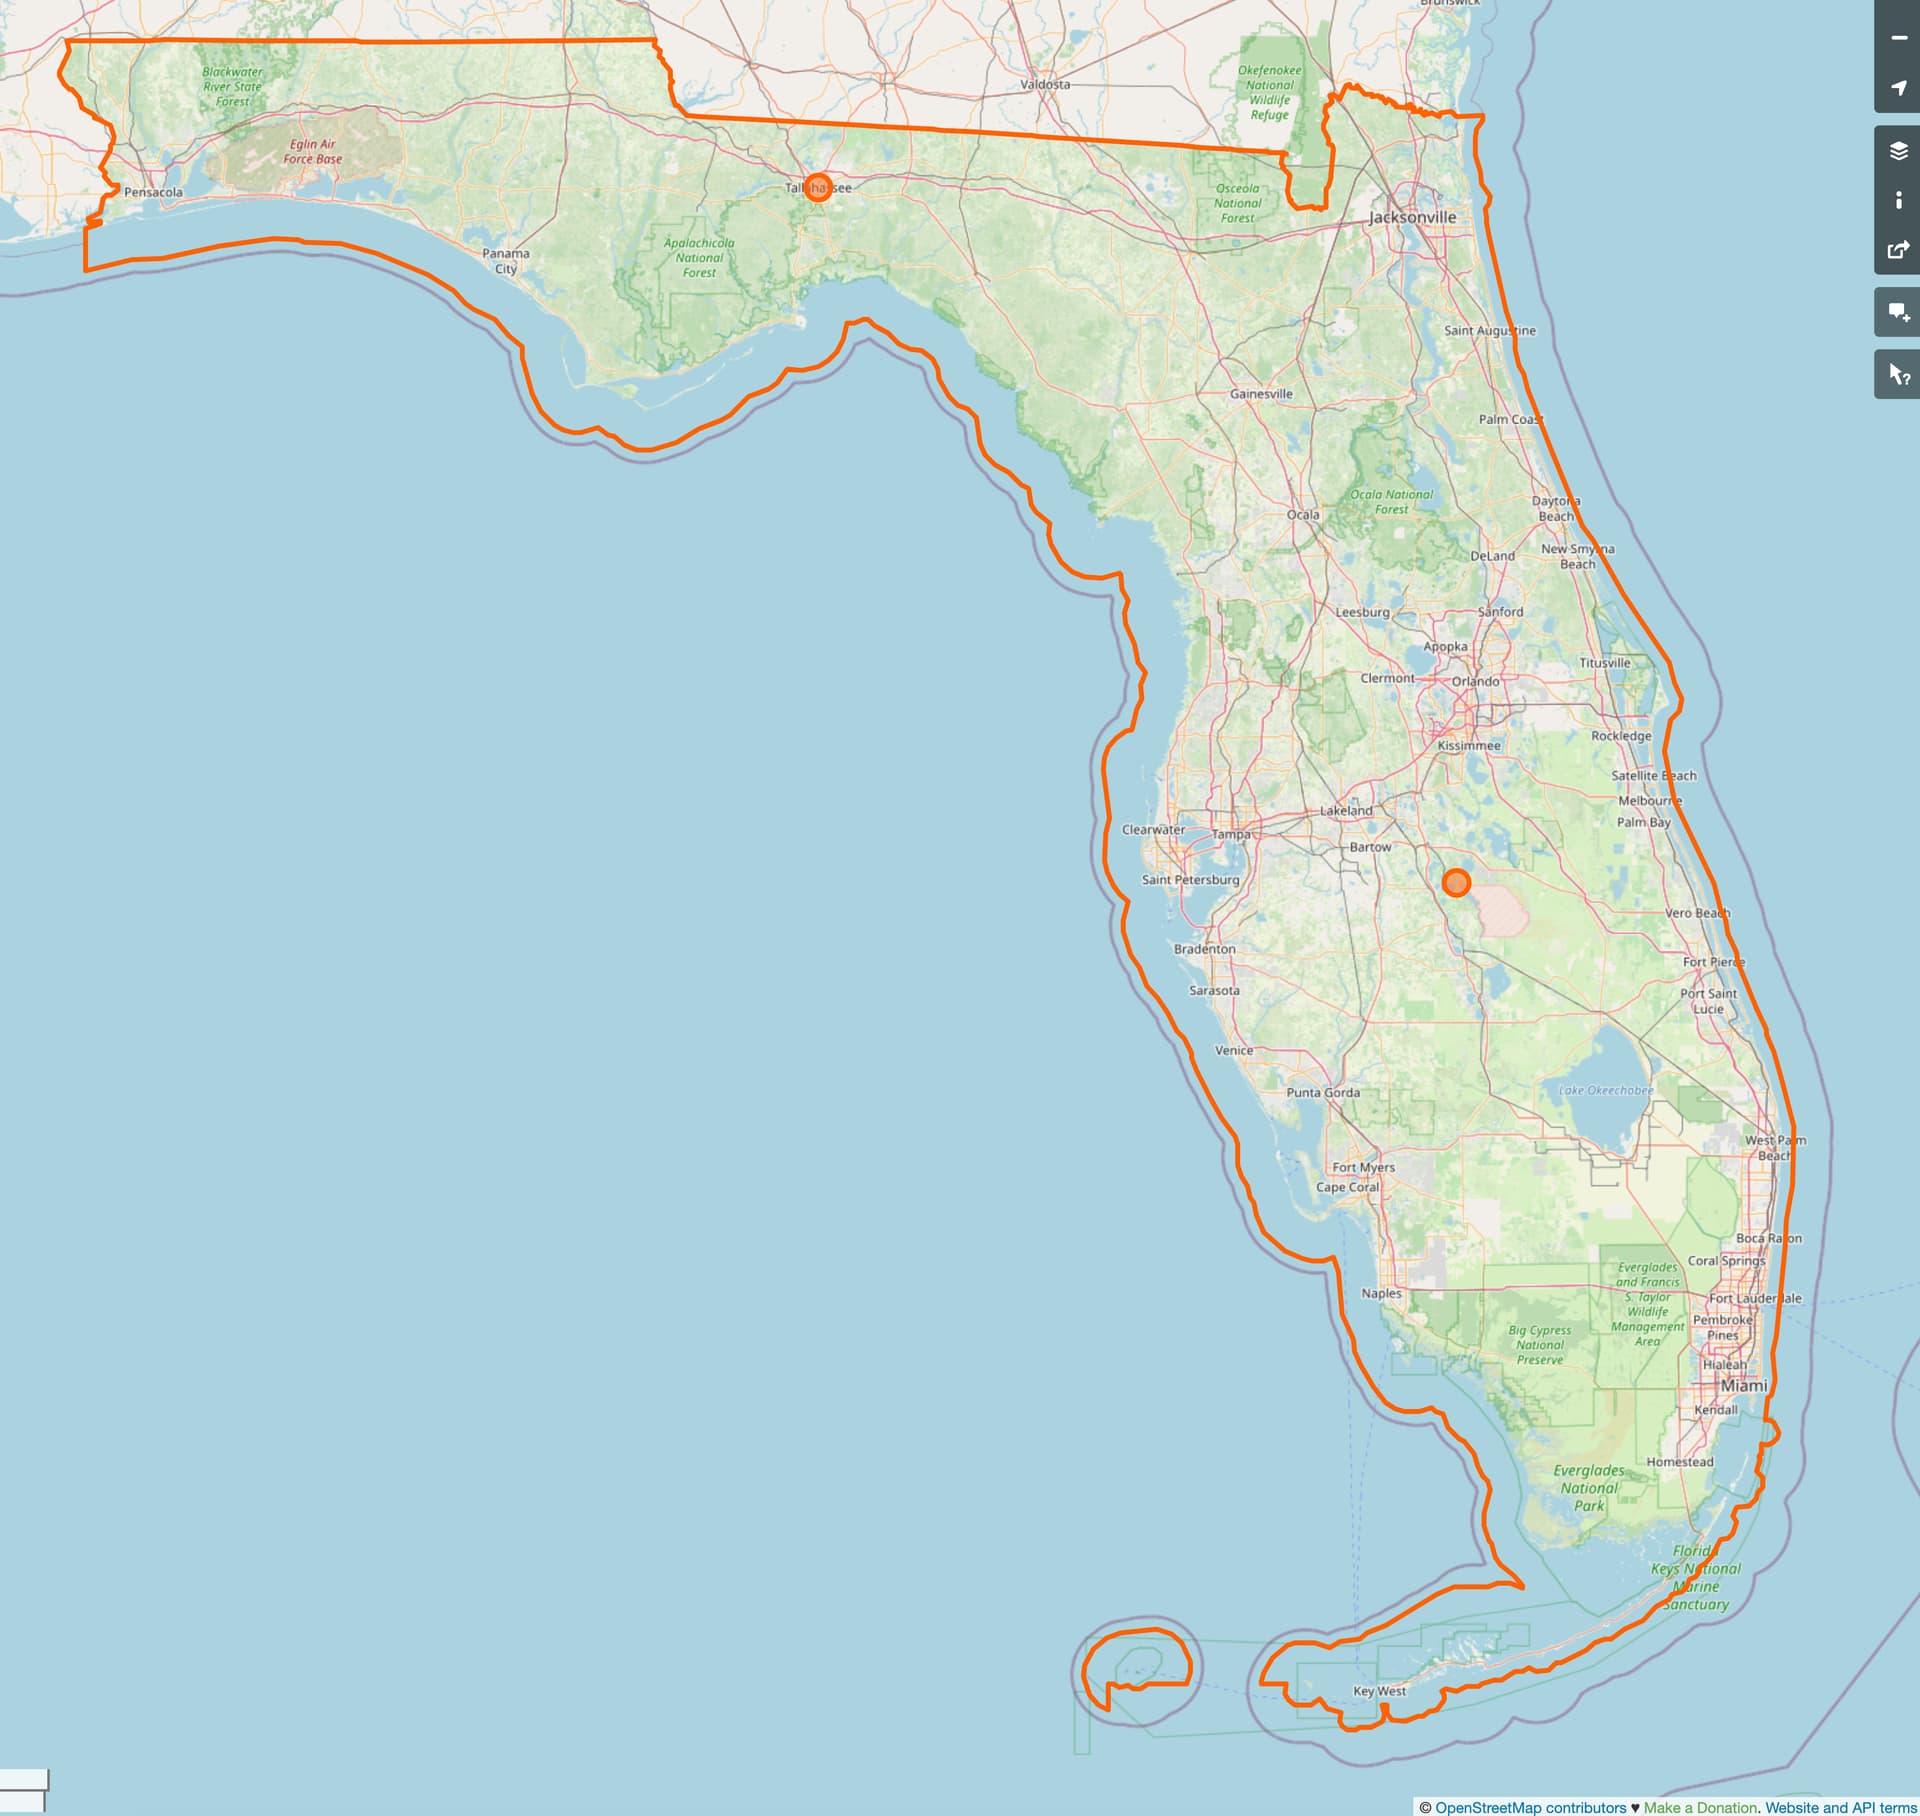
For example:
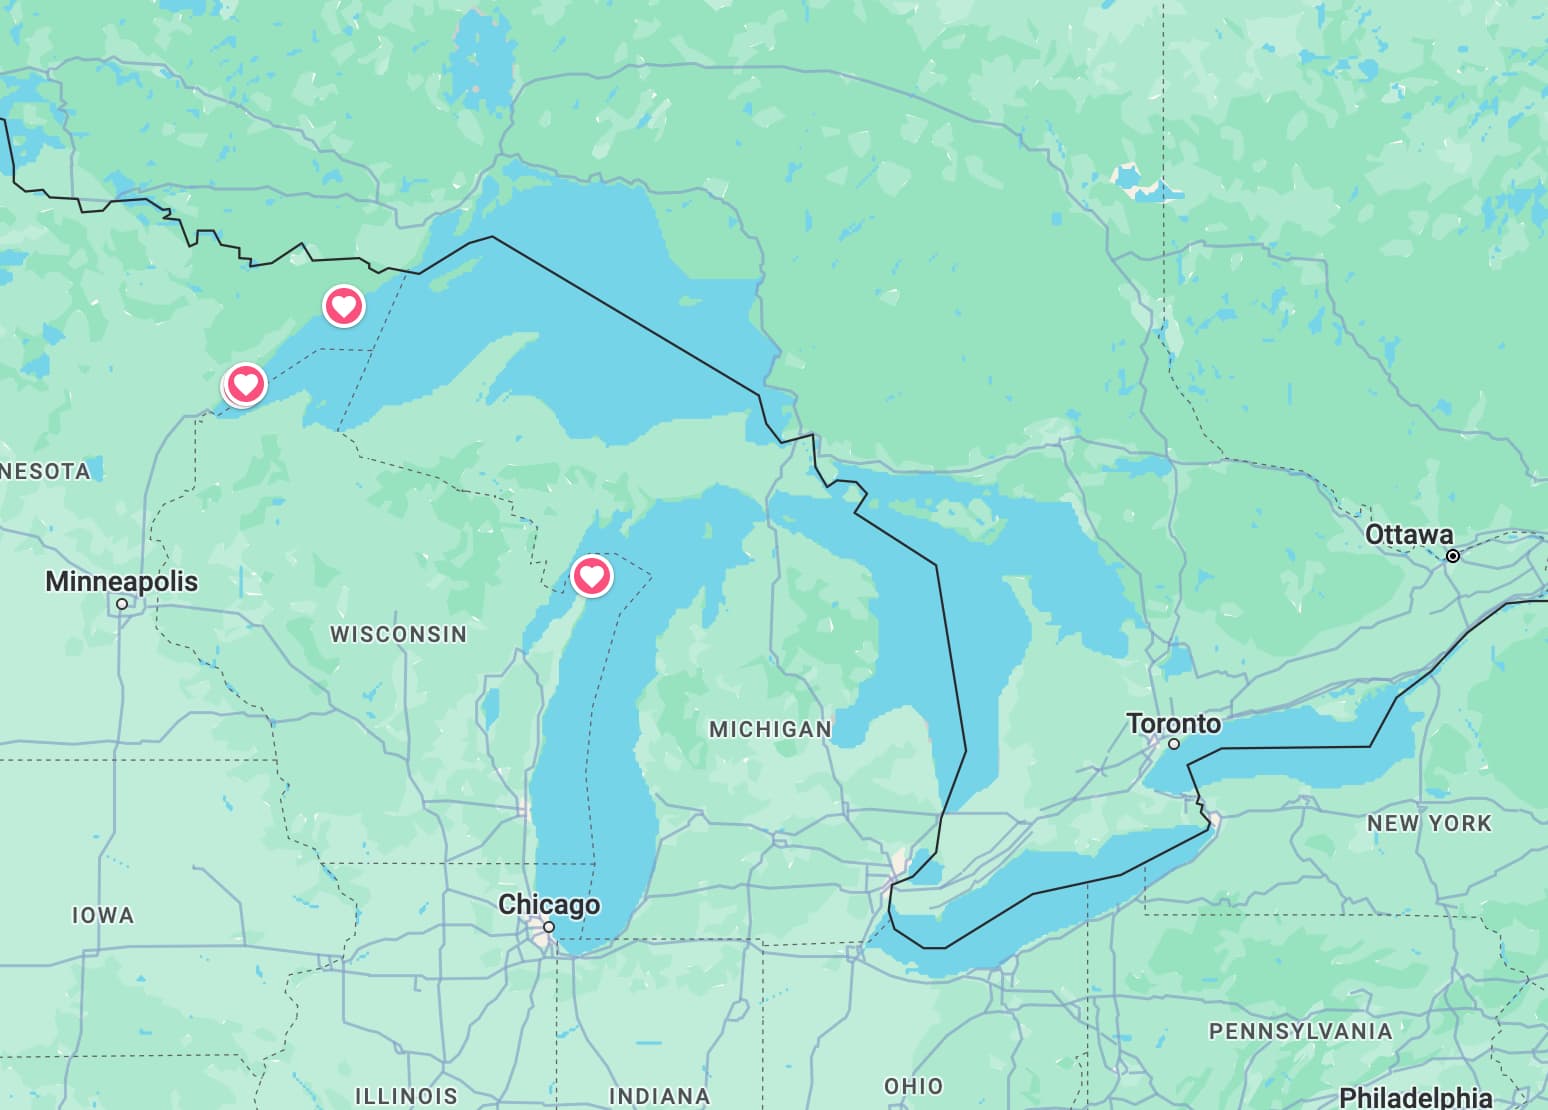
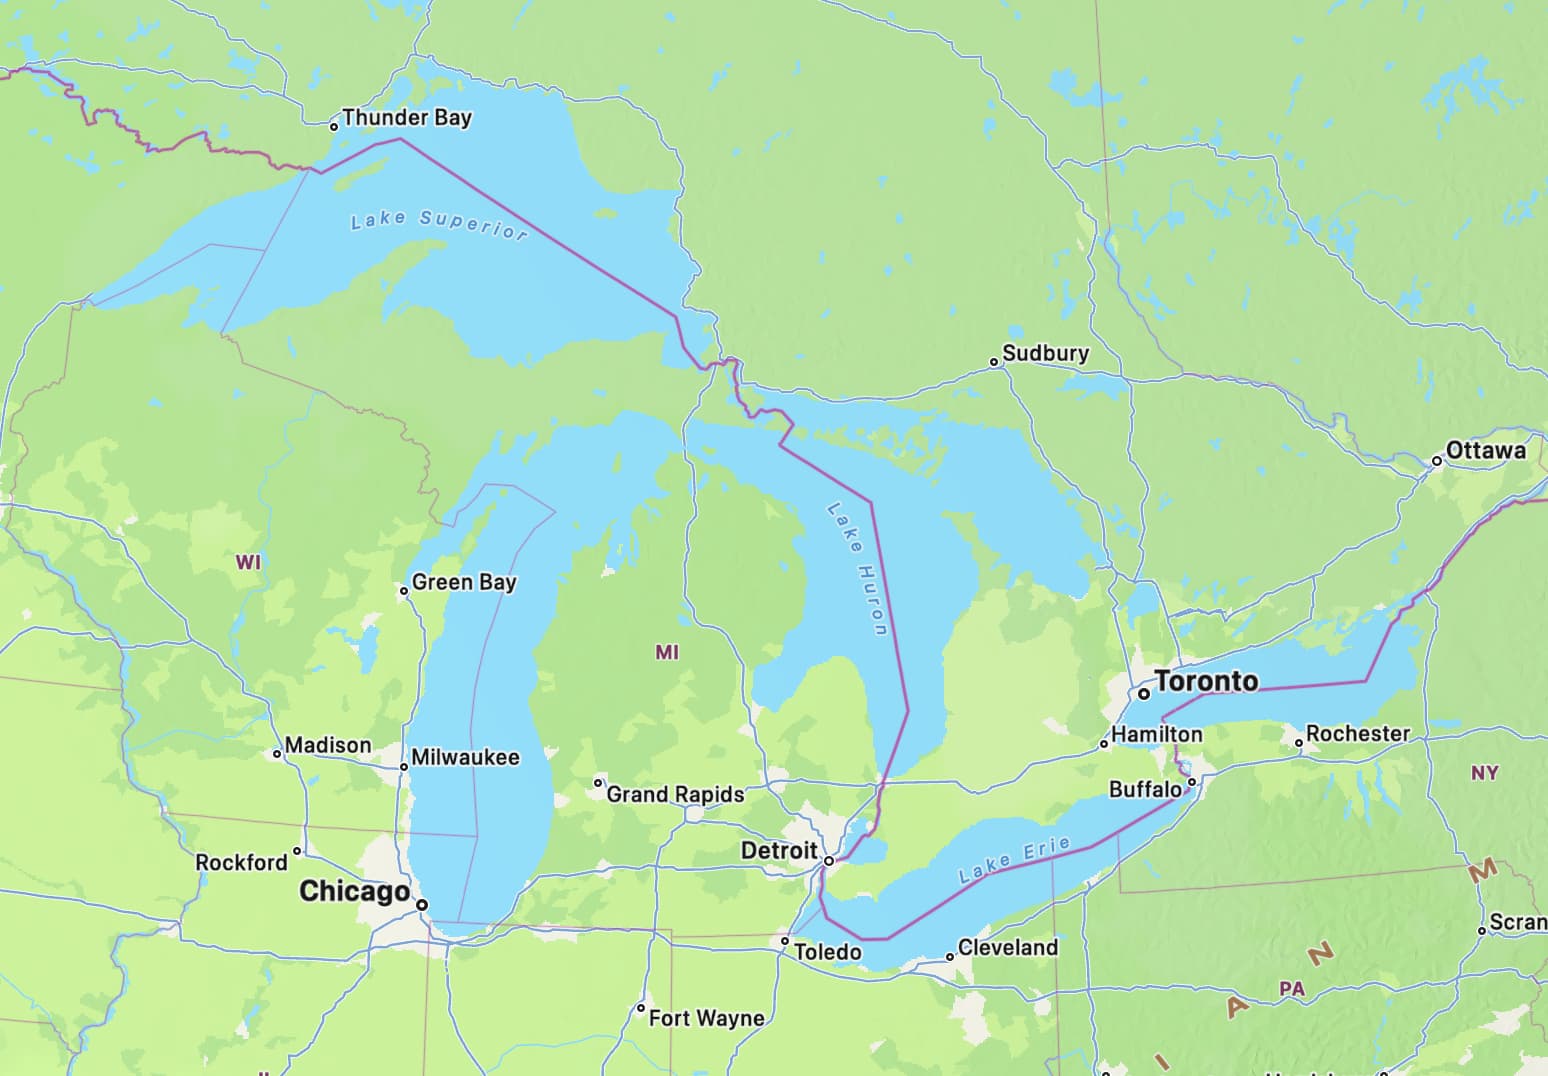
Other non-OSM-based web maps do not include territorial waters in the primary identification of boundaries - Google, Bing
The primary reason I believe we should have data structures for territories that include shorelines rather than territorial water boundaries as an outer edge is that shorelines are never optional in the rendering of a map. Territorial waters are, as shown above, or in numerous examples here.
The primary use case I have in mind is for extraction of simple illustrative boundary maps - either for education or for use as more flexible-than-svg maps on Wikimedia. In the future, I hope that teachers and Wikimedians will be able to come to OHM to get a black and white print out of administrative boundaries of Europe before World War I, or the United States in 1800 or Africa in 1850.
There are many different approaches that would satisfy needs for having both land-only and land-and-water boundaries in OHM, so I’m hoping we can have some discussion here about the best way of delivering this… or not!
Here’s one approach for handling administrative boundaries that include territorial waters - using 3 relations:
A base, land-only relation for an administrative entity that include shorelines and not territorial waters. This could be used for the educational and locator map purposes identified above.
A territorial waters-only relation. This might enable search results for anyone interested in the evolution of territorial waters over time.
The 3rd one sounds like a good candidate for a parent relation instead of including all the ways. This one could hold all the tags as well instead of needing to duplicate them on both, the water and the land relation.
I’m intrigued by the notion of boundaries that contain other boundaries, because what we’ve been calling boundaries are, in the real world, territories composed of boundary lines. However, so far, I’m not convinced that approach is appropriate for facilitating an arbitrary cartographic distinction between boundaries over land versus water.
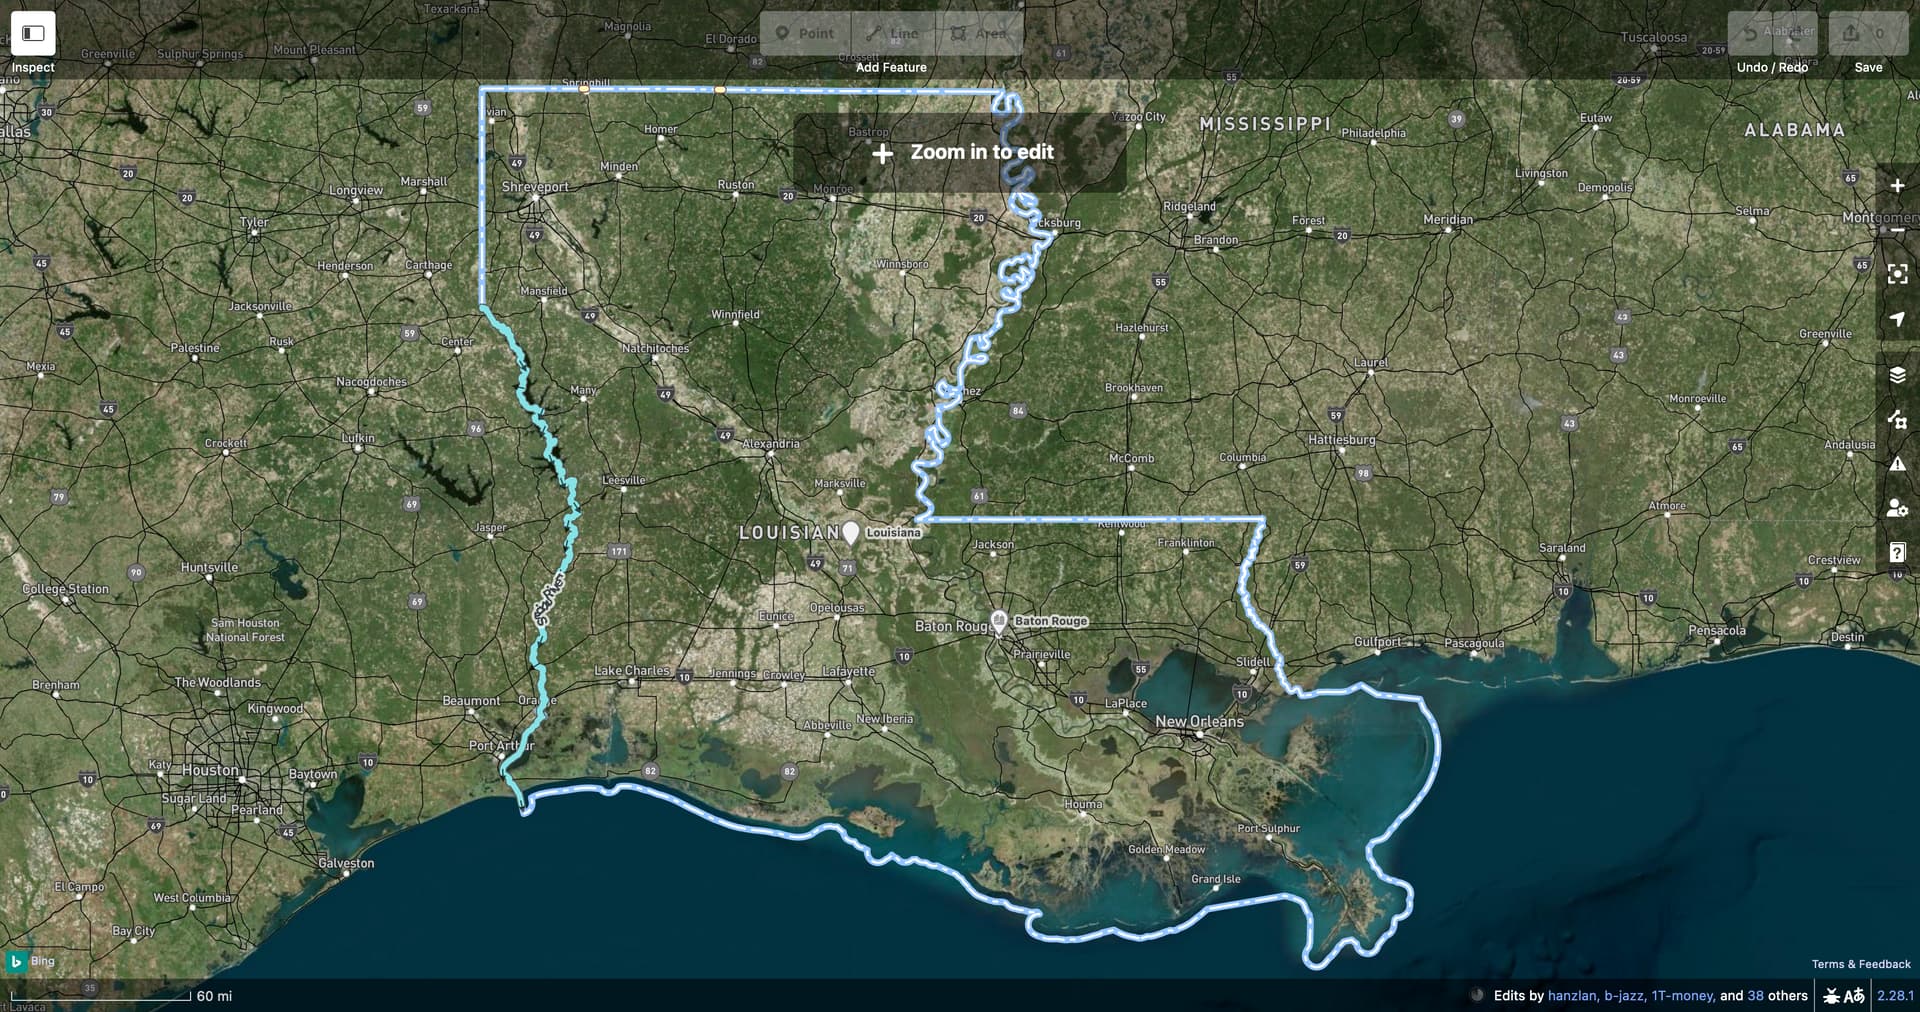
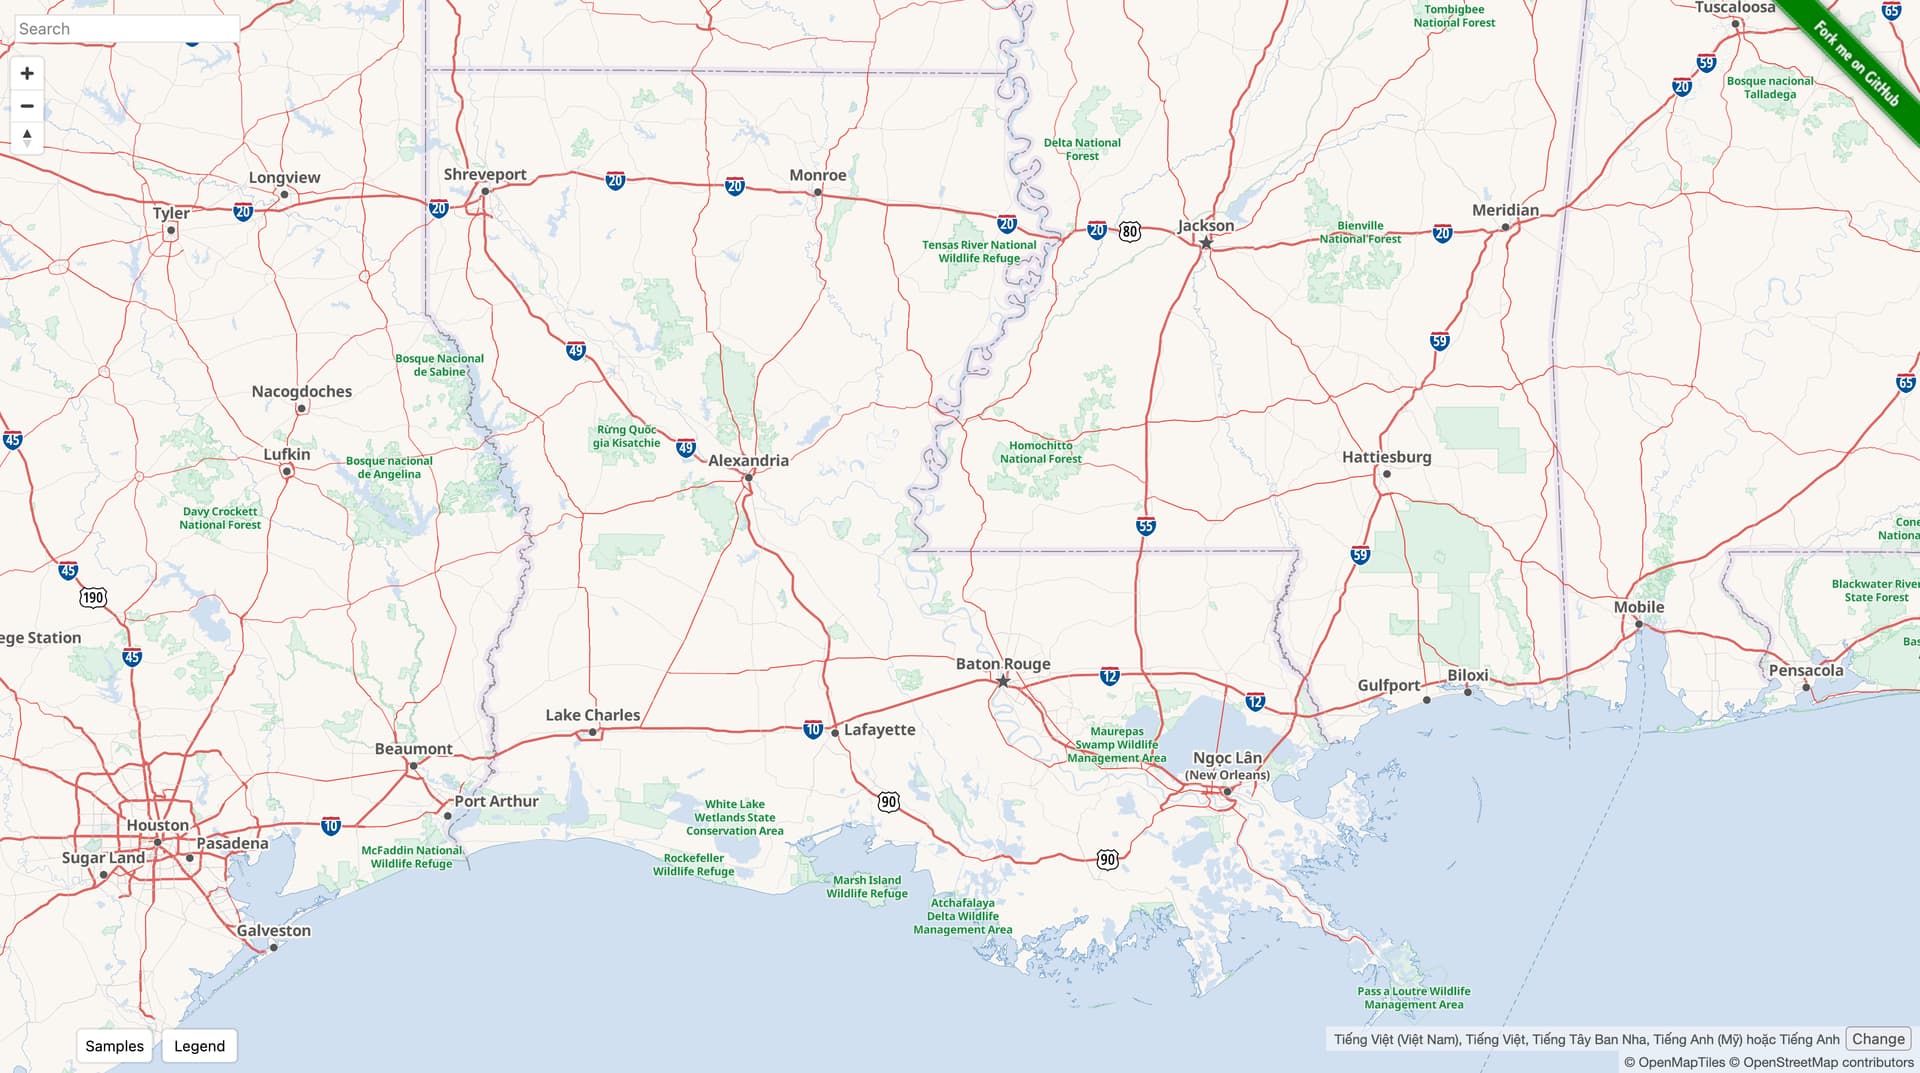
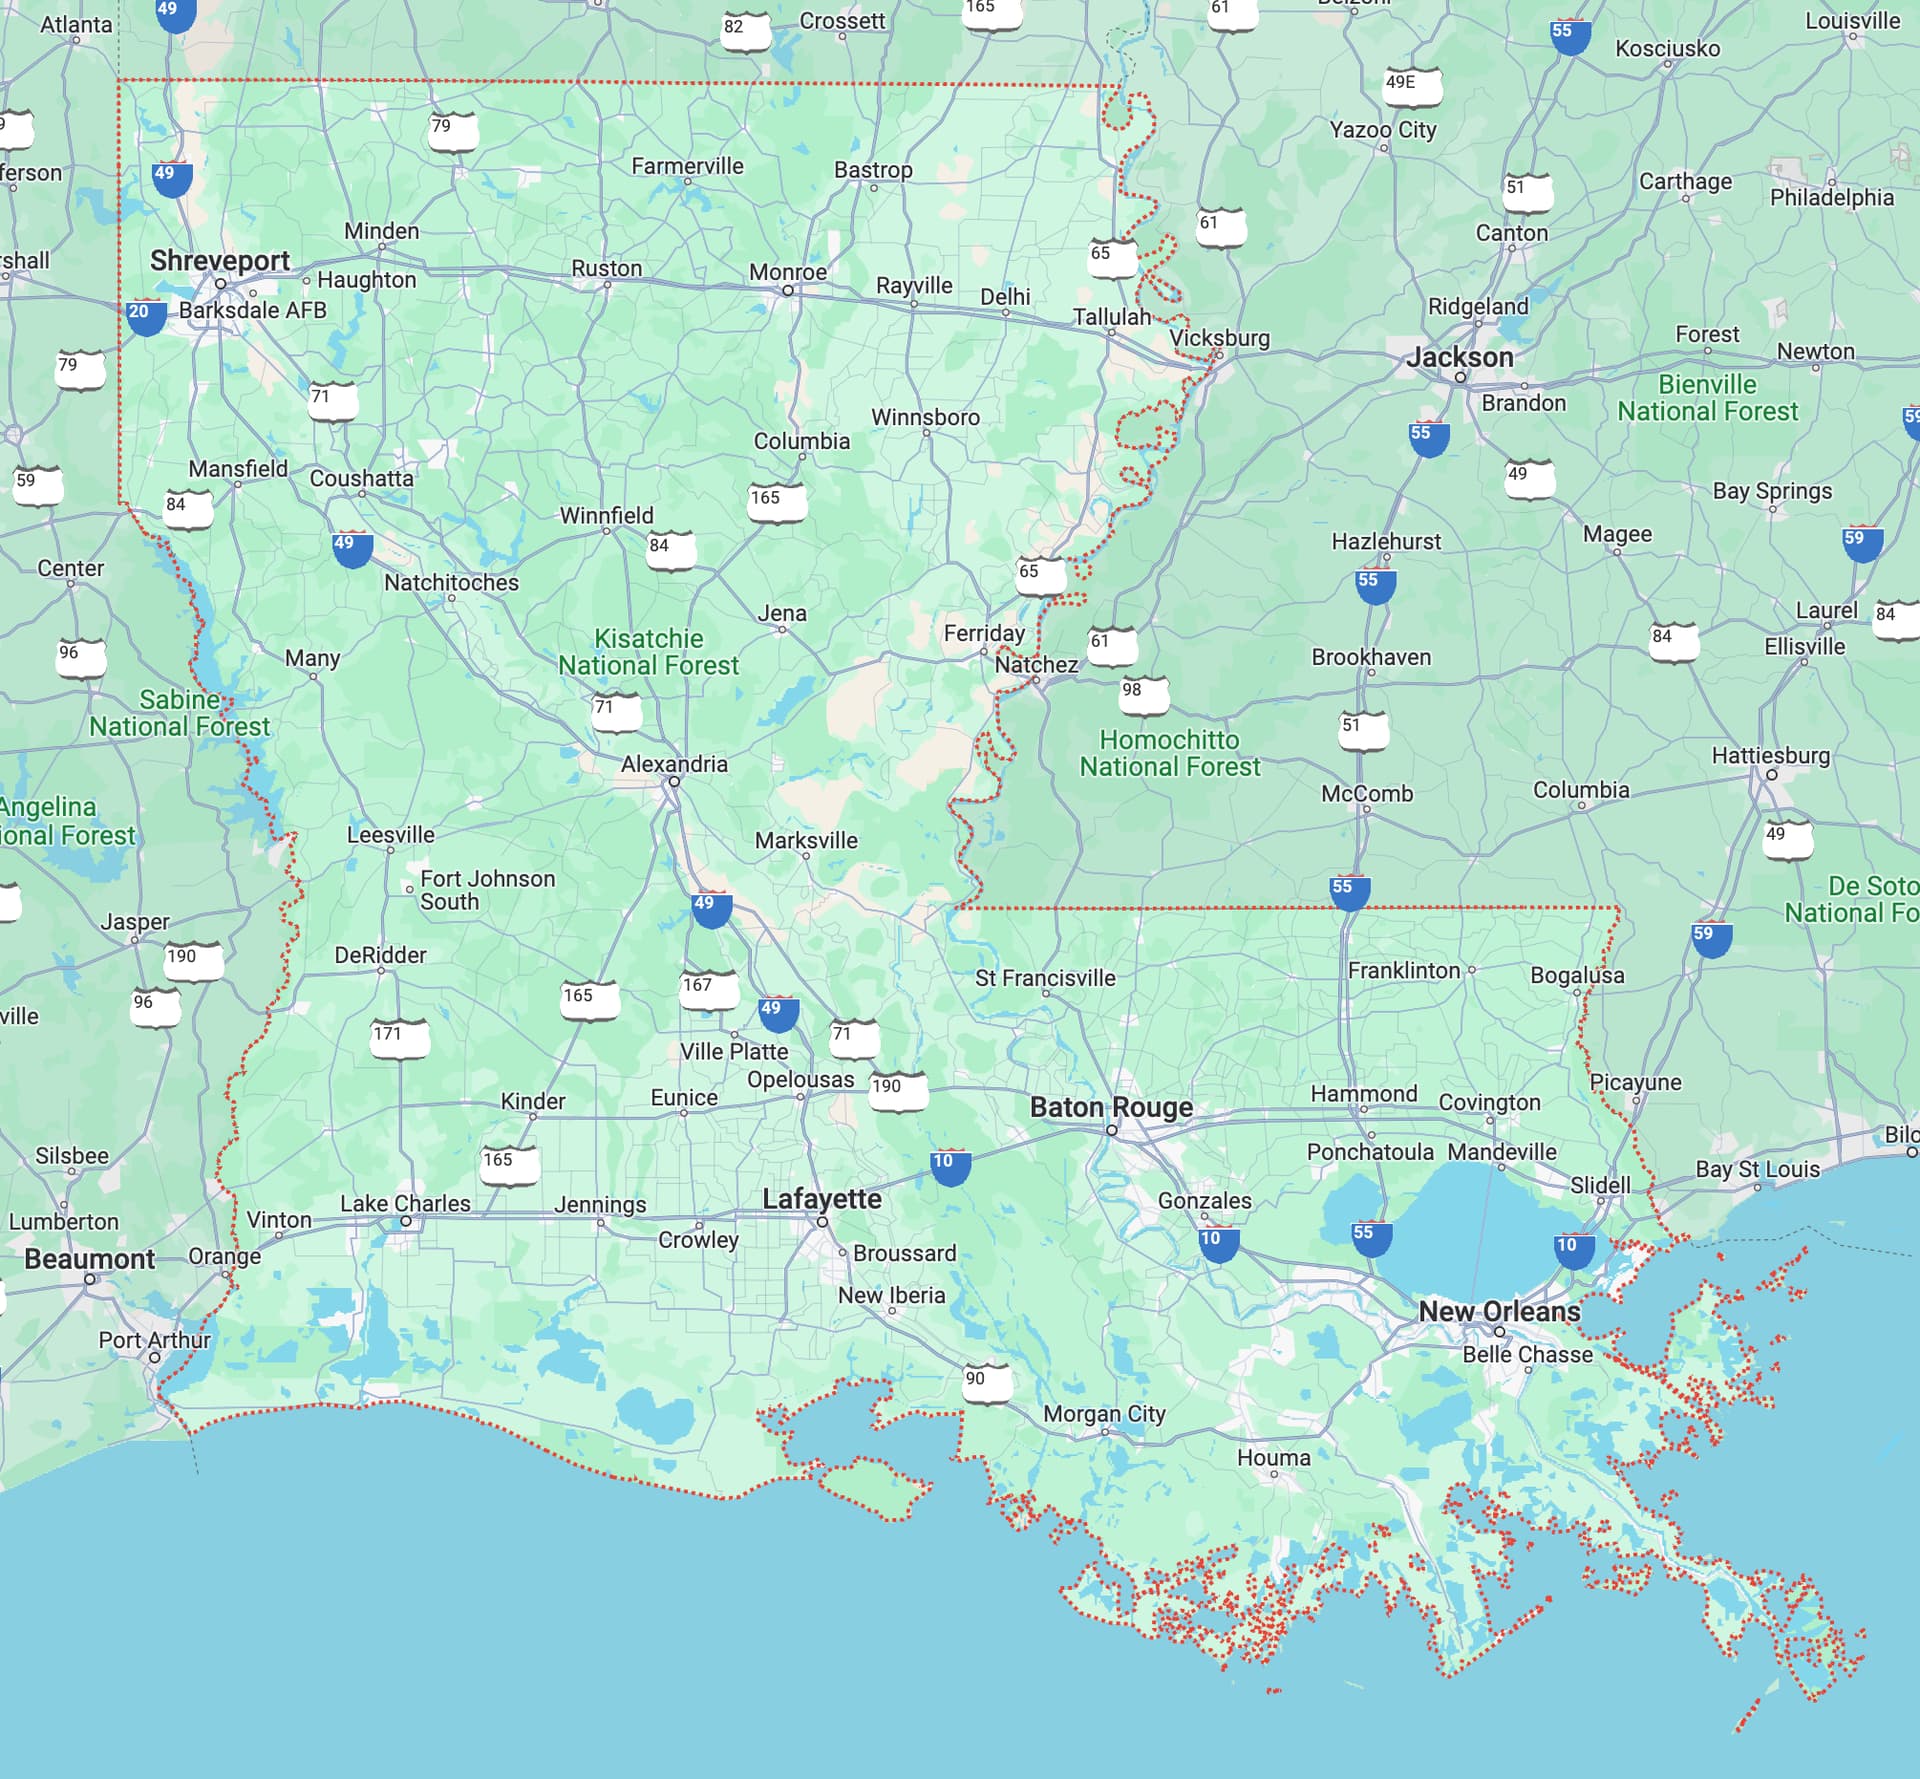
It’s important to distinguish between how renderers currently depict boundary relations and how they could depict them, even with the current boundaries in OSM. For example, even though OSM’s Louisiana boundary relation extends out into the Gulf of Mexico, beyond the barrier islands, many OSM-based maps, such as OSM Americana, only show the portion of the boundary on land and along rivers:
How does this work? Member ways of the boundary relation that lie in the Gulf of Mexico are tagged as maritime boundaries themselves: boundary=administrative plus maritime=yes. A tile generator, such as OpenMapTiles, exposes this tag to the stylesheet, which filters out the feature or styles it differently. This data-driven approach is consistent with how disputed and indefinite portions of boundary relations are also tagged, with disputed=yes and indefinite=yes,[1] respectively. Shortbread, which is slated to power OSM’s vector-based successor to OSM Carto, also equates natural=coastline with maritime=yes, since stylesheets that hide maritime boundaries typically don’t want them cluttering up coastlines either.
A more automated approach relies on the renderer to only render the ways that are members of two neighboring boundary relations. OSM Carto came close to implementing this approach as part of a rewrite that unfortunately did not make it into production for unrelated reasons.
Almost 900 ways in OHM are currently tagged with maritime=yes, ready to be omitted from the Historic style. Most of them are in Asia, but we could retag U.S. boundaries as we clean them up. It may even be feasible for OHM’s tile generator to implement the more automated approach, depending on how it’s currently storing the relations and assembling them into polygons.
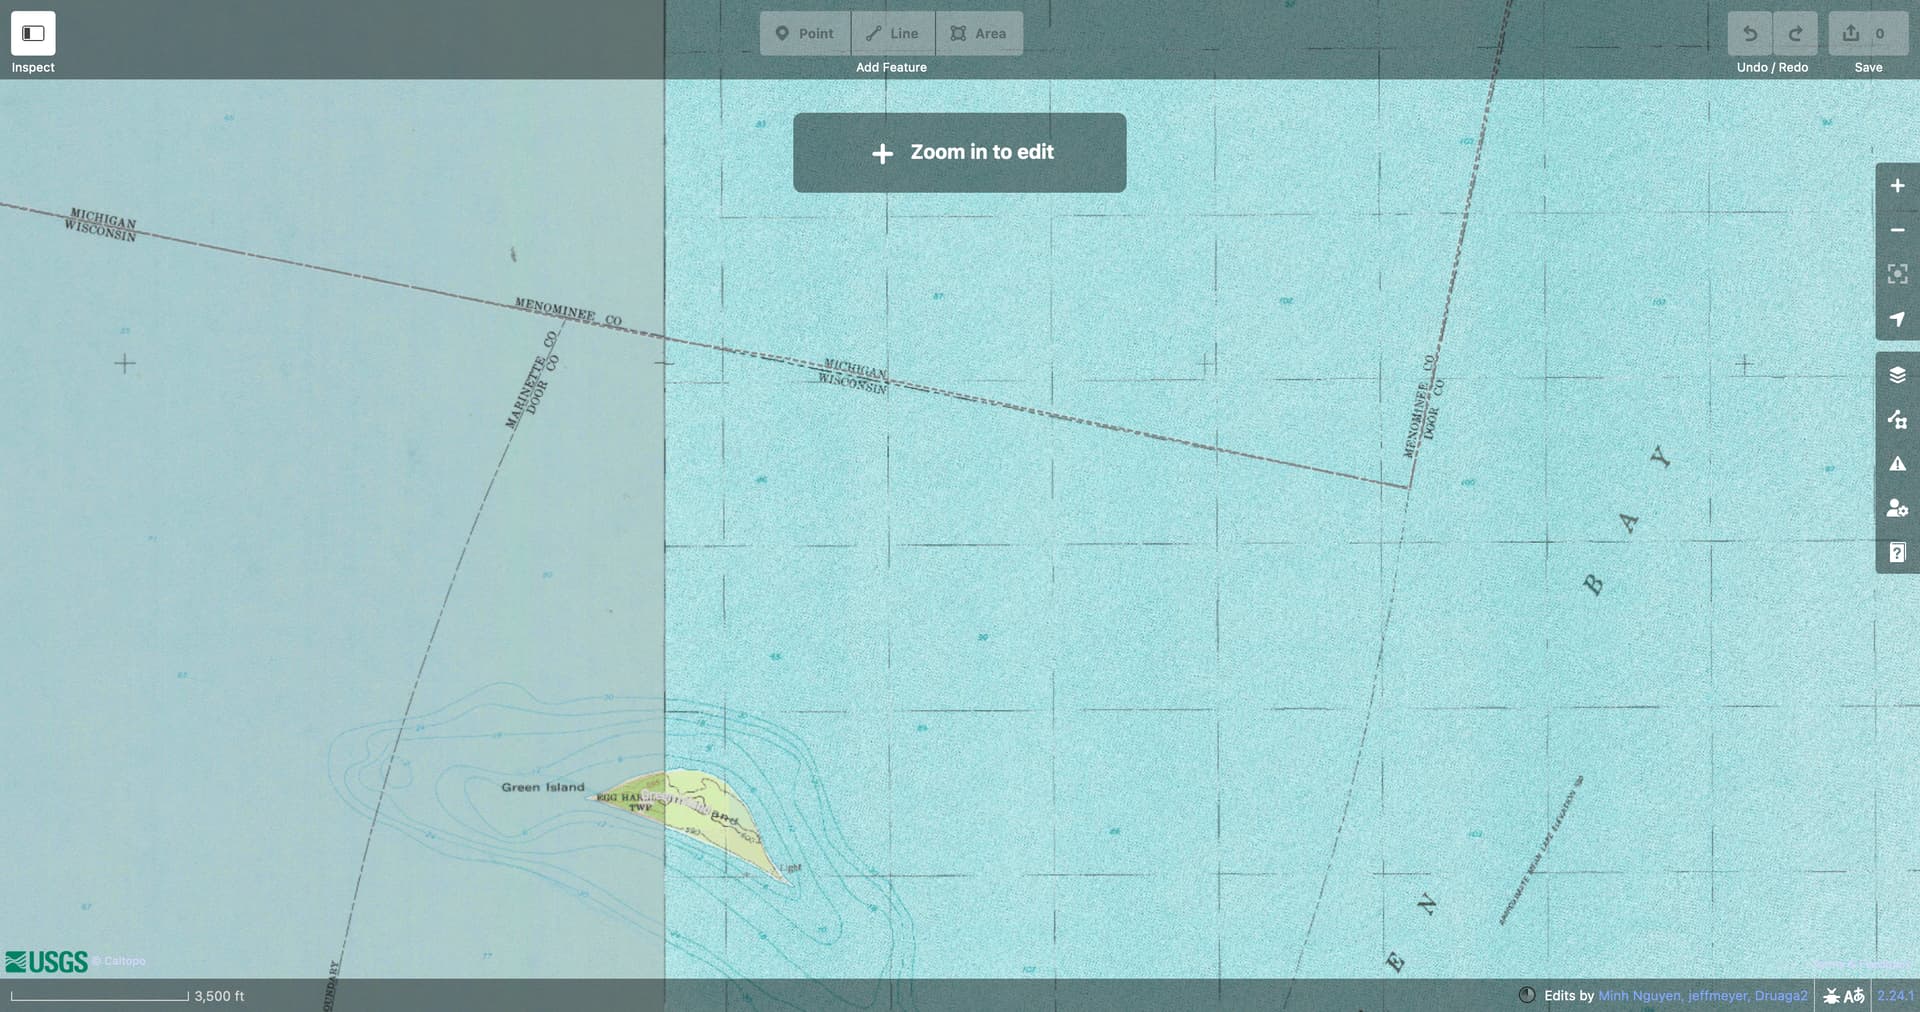
Most topographic maps do include territorial waters when known, and even sometimes when only indefinite boundaries are known. When I extended the Newberry boundaries into the Great Lakes, I relied heavily on the definite and indefinite boundary markings in USGS topo maps.
These maps are certainly in the minority, especially when considering historical maps, but every kind of map shows a different selection of boundaries. These same topo maps show rancho boundaries, which are fairly unique to OpenHistoricalMap.
It depends on a given country’s relationship to the sea. Countries that lay claim to waters in the South China Sea, for example, consider (their) waters and maritime boundaries to be a mandatory part of any map. Archipelago nations also tend to give more prominence to the surrounding waters on their maps. Excluding territorial waters from the country’s territory is often seen as a political statement, depending on the context.
Your use case is real, but it doesn’t rule out the possibility of maritime boundaries as an integral part of the boundary relation. Indeed, when I put together a time series animation of time zone boundaries, I was going for a floating-territory treatment for simplicity, and I also needed to render county lines. I eschewed OHM’s county boundaries in favor of the original Newberry Library boundaries, but only because of inconsistency in OHM: only a handful of states and their counties had been extended into the water. If OHM were more consistent, I would’ve downloaded the county boundaries from OHM, which align better with the time zone boundaries, in order to intersect them with coastlines from Natural Earth.[2] Producing a polished static map from OHM data all but requires a GIS tool like QGIS that offers a straightforward intersection operation.
Use cases are one thing, but semantics and logistics also matter. The Newberry dataset made a key choice to exclude territorial waters from county and state boundaries. This led it to omit or misrepresent some nontrivial historical events. For example, Ohio had only extended its state line to the middle of Lake Erie after fighting a war with the British in 1812, but it was a dispute with Michigan over Toledo in 1835 that finally convinced the state to extend the county boundaries into the lake as well. The dataset omitted this change entirely. Every coastal county boundary changed in 1947, when the U.S. Supreme Court ruled that all territorial waters belong to the federal government, right up to the coastline and all the way up San Francisco Bay, and again in 1953, when Congress formally restored the 3-nautical-mile state limit that had previously been assumed under state charters. Someone studying a land-only boundary relation would be oblivious to these changes.
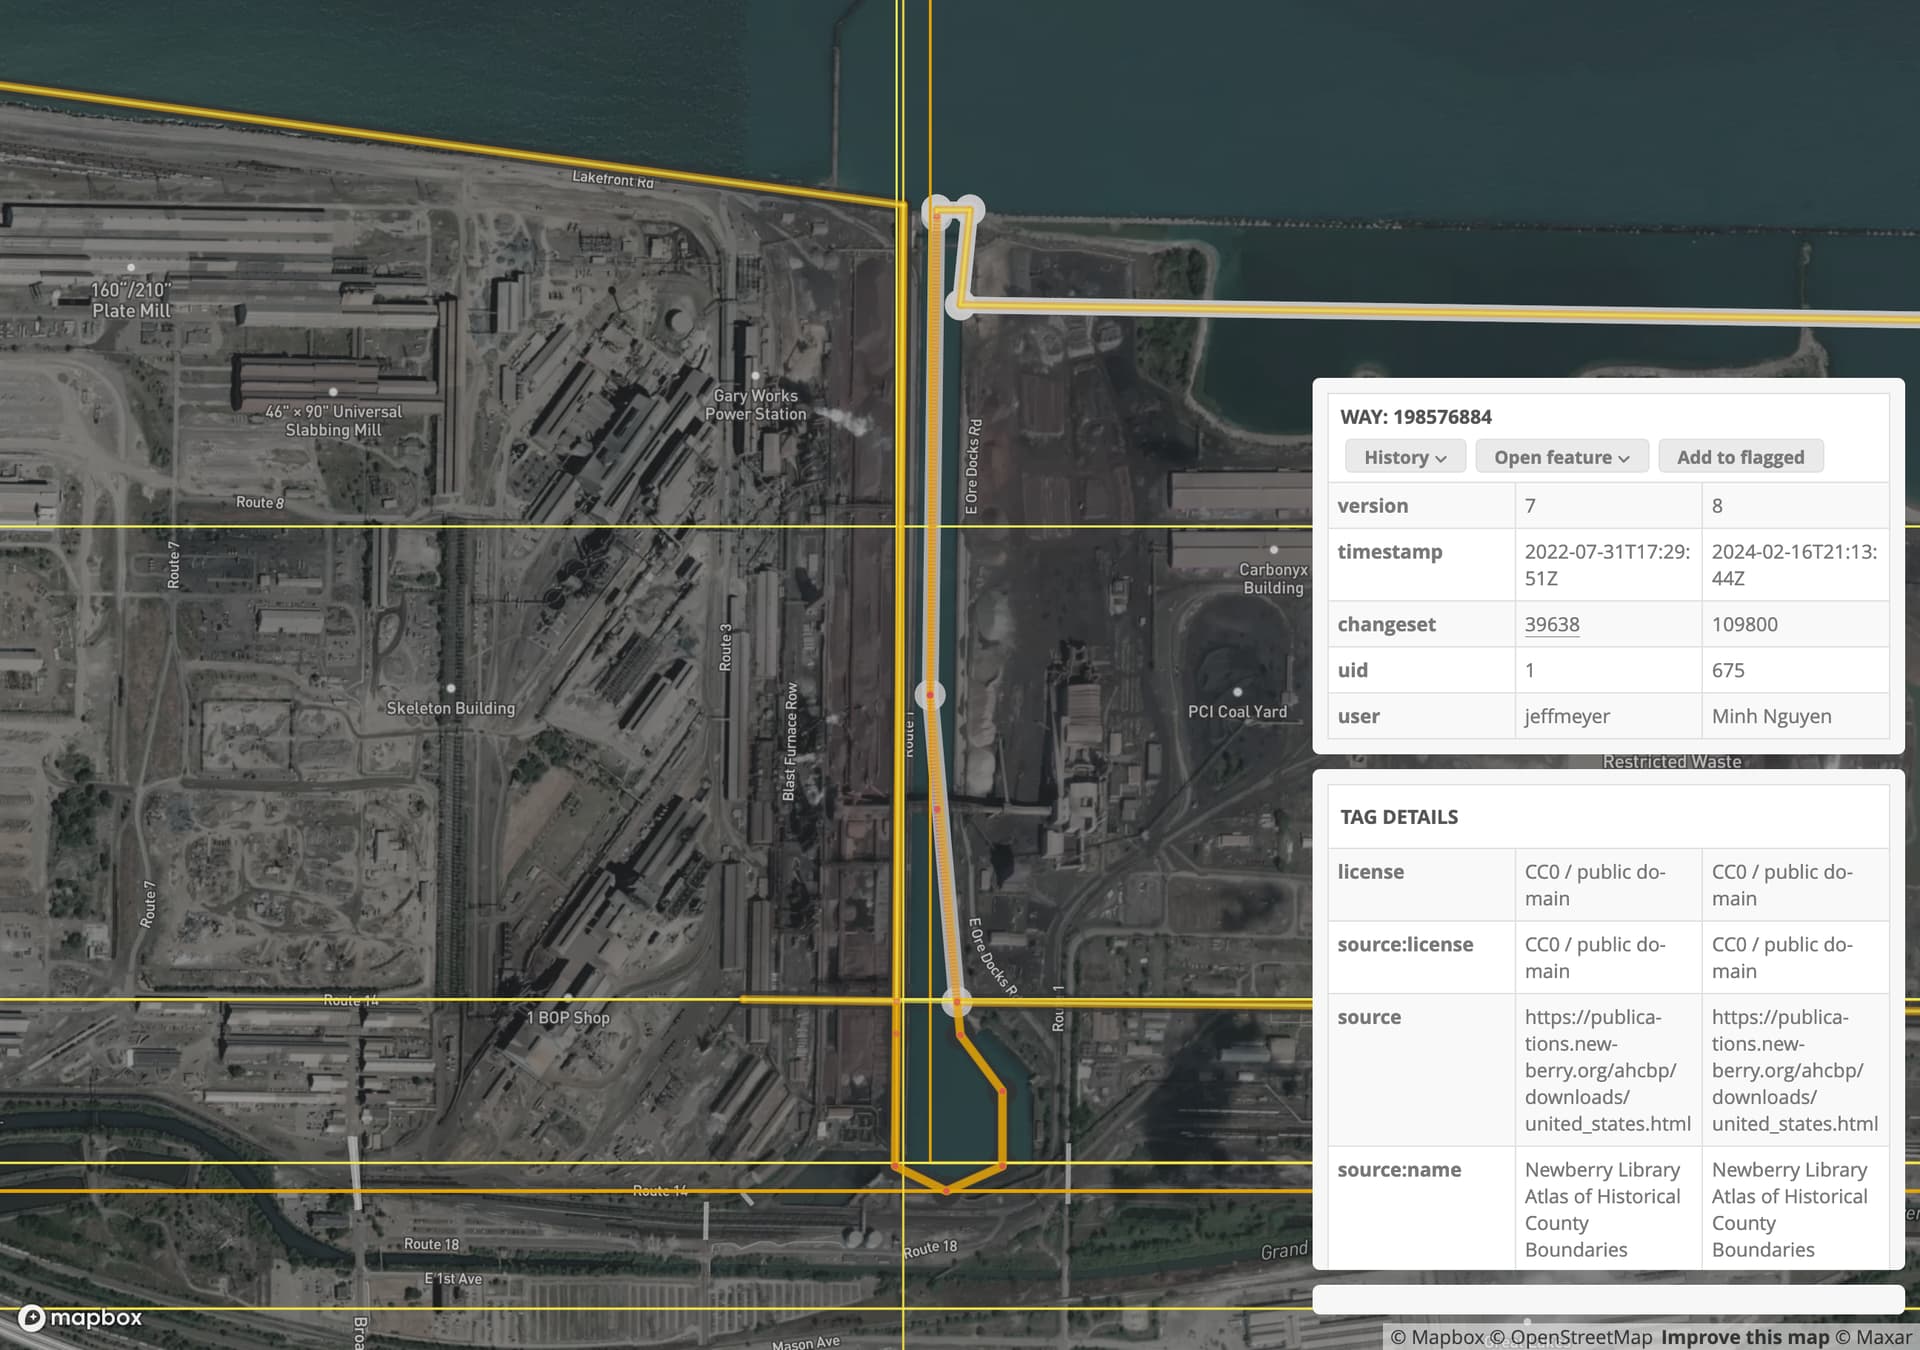
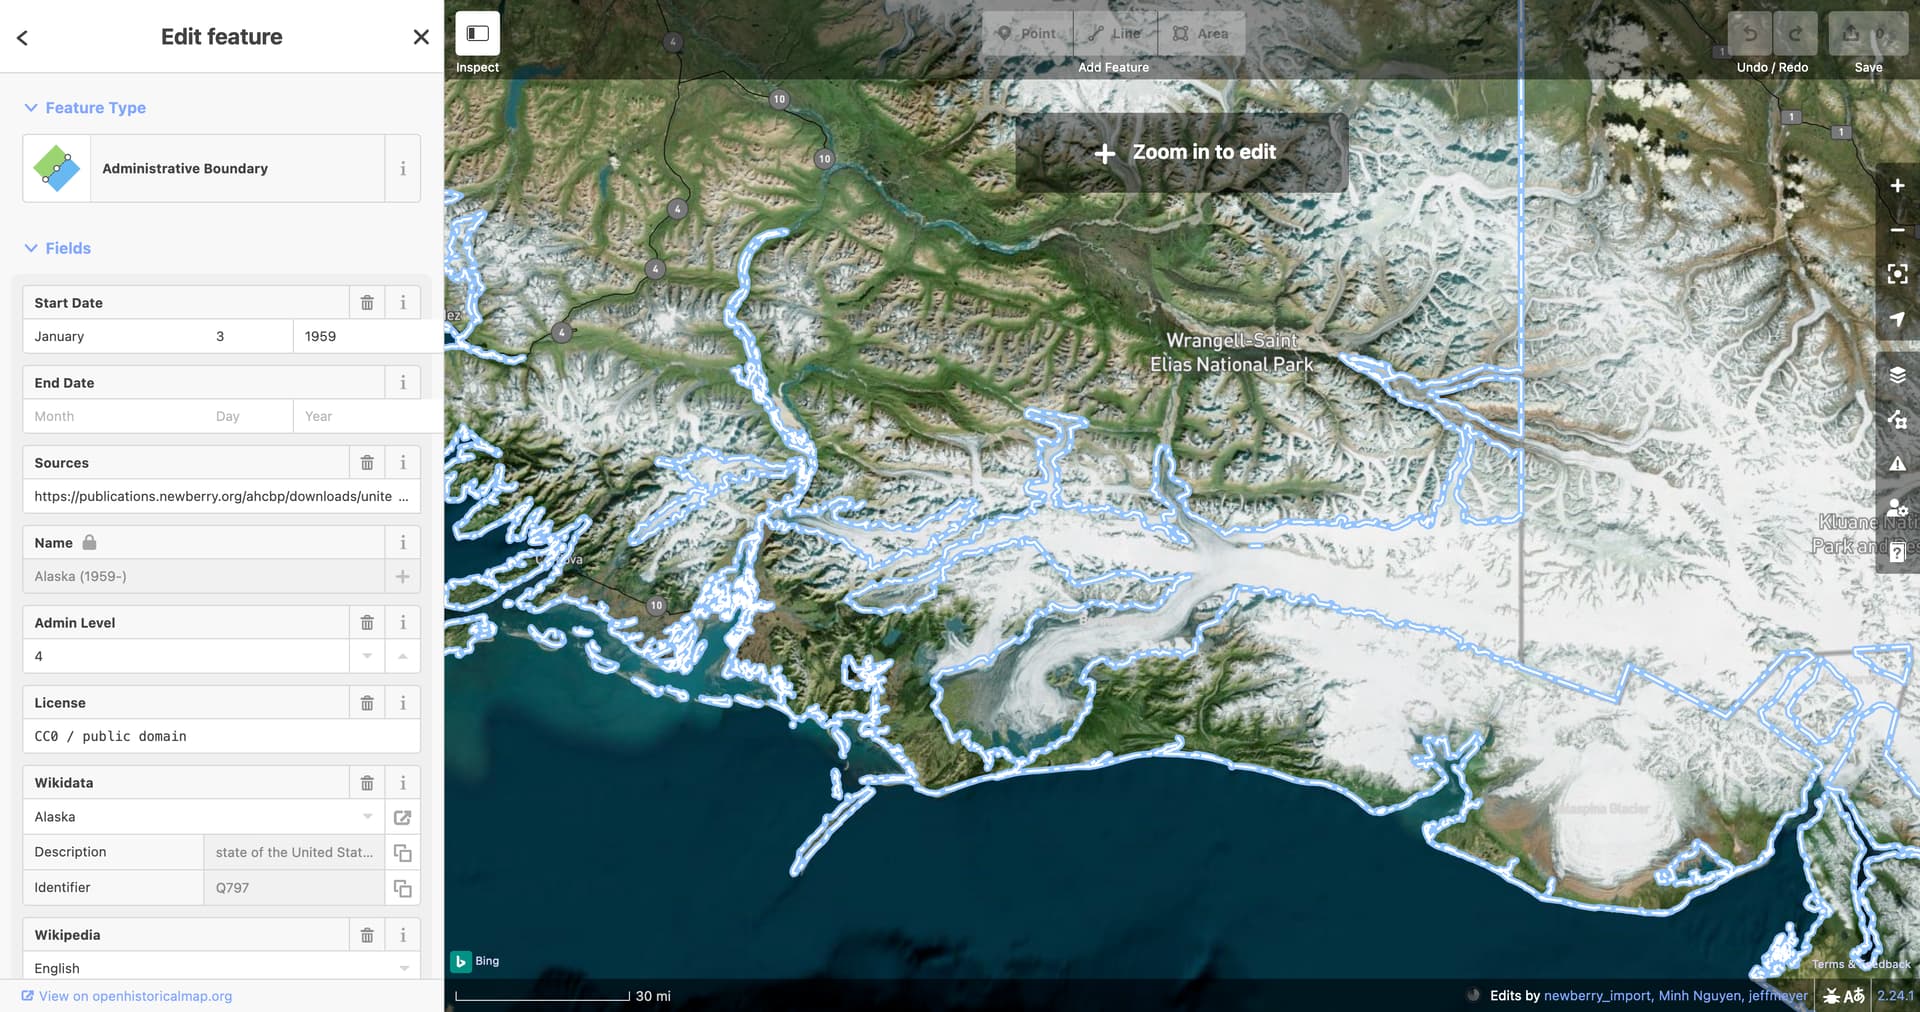
The Newberry dataset also had to decide about where the “land” begins. They cut out bays and harbors large and small, from the San Francisco Bay to Gary Harbor, an artificial channel. And since glaciers can obscure the edges of bodies of water, they cut out many of Alaska’s glaciers, dividing mainland Alaska into several islands.
Worse, by insisting that boundaries hug coastlines, the dataset created some monstrously complex geometries. The relation for Alaska alone has over 1,700 member ways. Several other coastal states have hundreds of members each. Many of these ways exist because of the API limit on how many nodes can be in a single way.
Yet the Newberry dataset is already heavily simplified, omitting a great many islands. For comparison, OSM’s representation of the Tongass National Forest accurately hugs each island for a total member count of 29,000, which is so large that some data consumers blacklist this specific relation and your IP address will be automatically blocked from OSM.org if you try to load it a few times in short succession. The Tongass relation covers only a fraction of Alaska’s coast. Imagine if this becomes part of the United States boundary post-1867. Now imagine that, because OHM also splits boundaries due to historical changes, the United States boundary exceeds the 32,000-member limit set by the API.
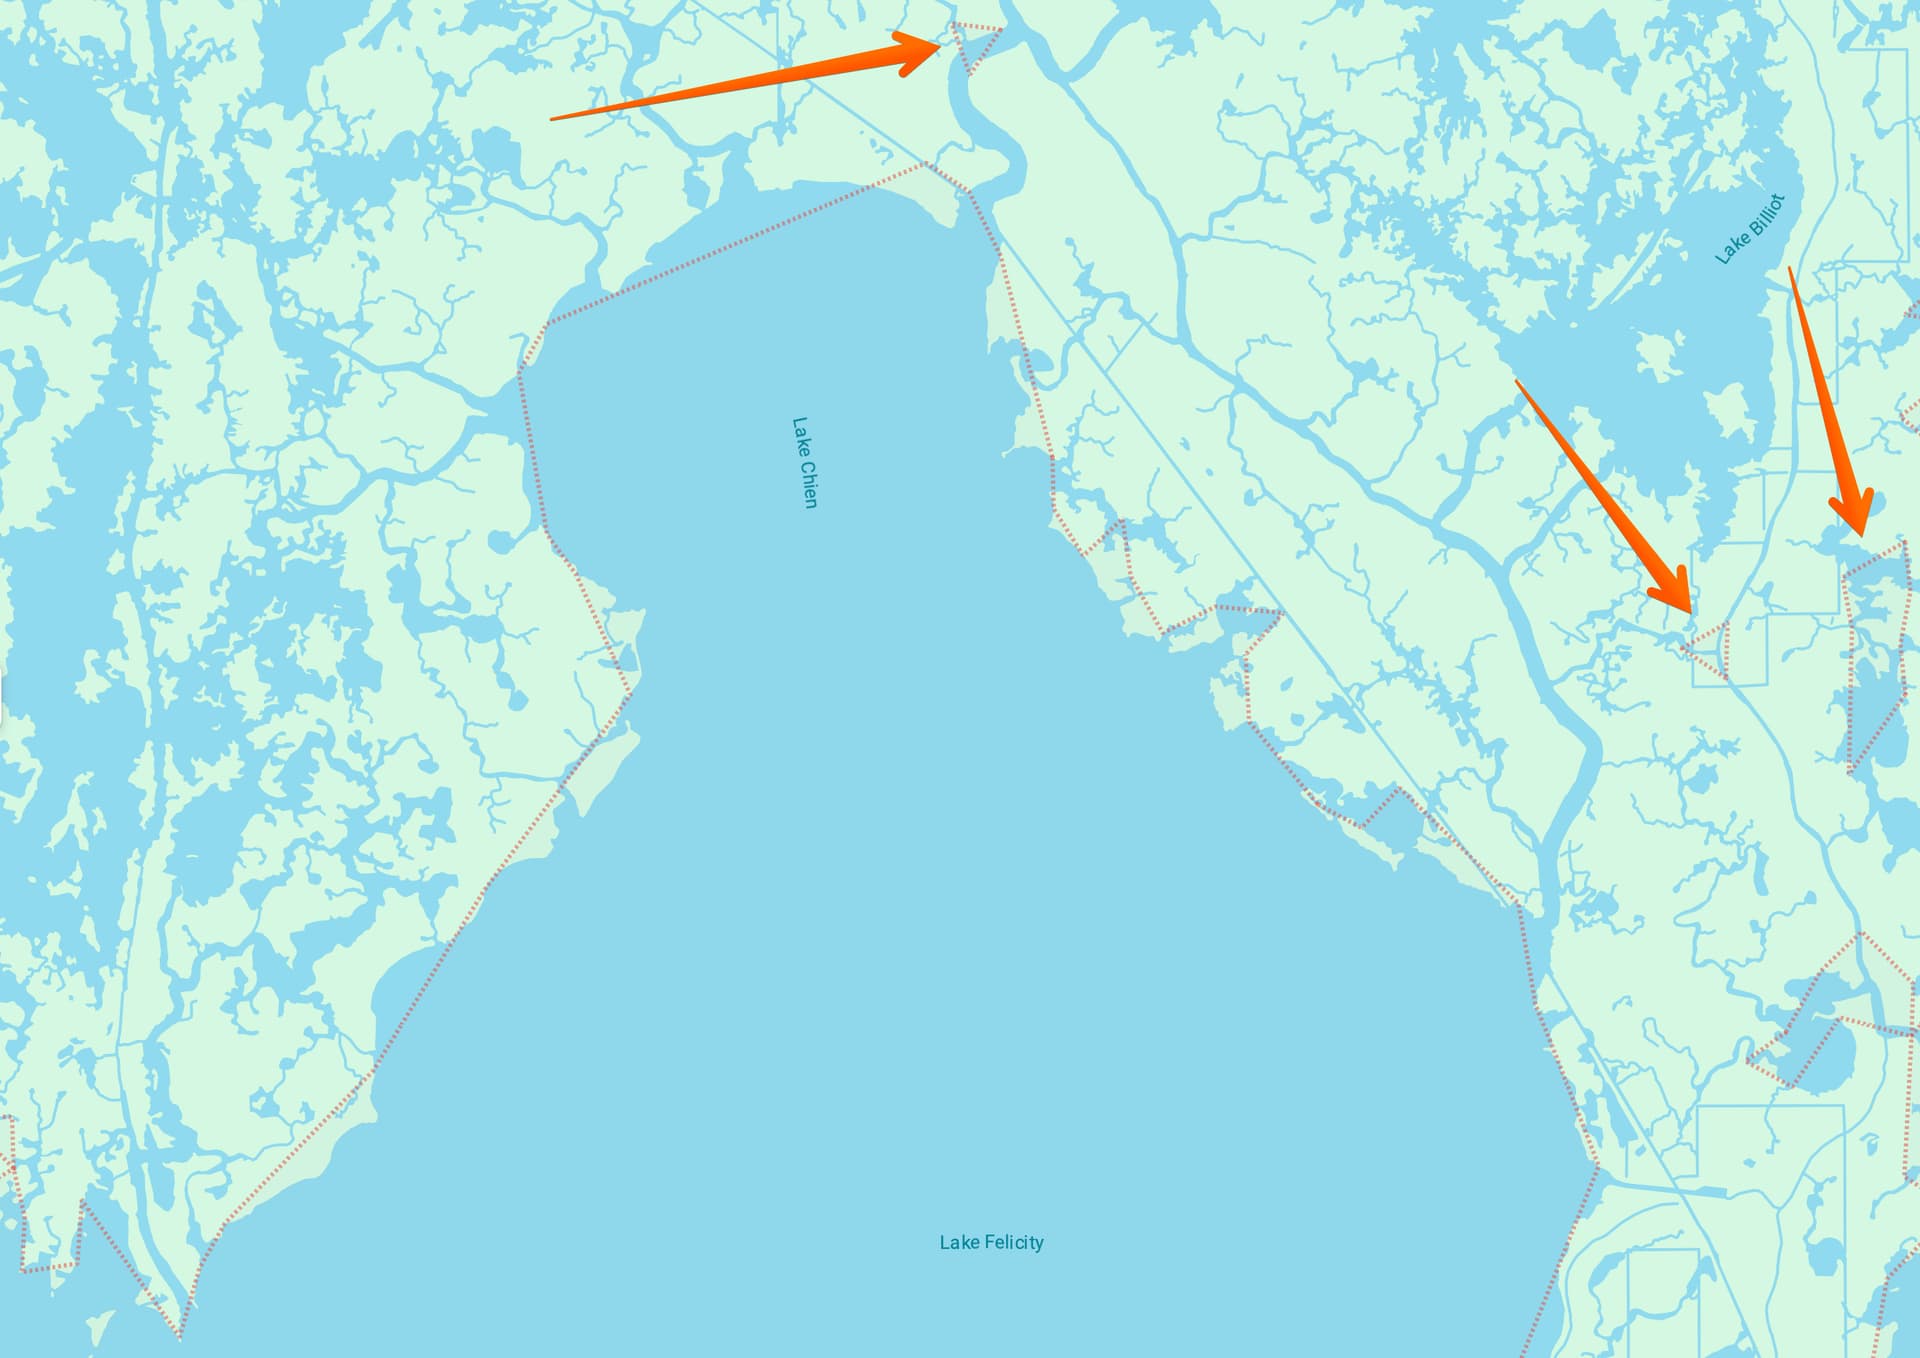
Another problem is that coastlines change without changing the boundary. For decades, Louisiana’s coastline has permanently receded with every high tide, and the countless artificial channels leading inland get ever wider. Even if we can only track these changes on an annual basis rather than a daily basis, I think our efforts would be better spent modeling the coastline itself rather than “boundaries” that are based on it.
In general, I’m not one to let technical limitations dictate our data model. However, I think it coincides with a broader point, that we need to be less restrictive than OSM about our inclusion policy for boundaries. Maritime boundaries have been controversial in OSM because they’re inherently less observable “on the ground”. As a more research-oriented project, I think we can afford to relax that constraint as long as the boundaries are based on credible sources. I would rather not emulate OSM’s controversy here just because it looks good in the current state of our renderer or when styling our boundary relations verbatim.
I picked indefinite over indeterminate, which also appears on some maps, based on the relative popularity of “indefinite boundary” until the 1990s according to Google Ngram Viewer. ↩︎
At the moment, OHM coastlines are probably too broken to form a complete multipolygon around the seas. ↩︎
As usual, a great & insightful post. In particular, it’s making me think my desire for a simplified output that could be provided for locator maps or use in classroom instruction or historical illustration would be better met with an intermediate processing step, rather than with a direct download of source OHM data. What I have in mind is more like a Natural Earth dataset of historical boundaries (no maritime boundaries) or a form for download of the same. Most of these use cases do not require zoom level 19 levels of detail in their shapes.
The points about the Newberry dataset are all well-taken, but that’s not really been guiding my thinking on this. I’ve always hoped / assumed that the shorelines and island shortfalls in that dataset would be rejected / hidden somehow or replaced with higher fidelity data.
It’s also evident that even Google uses an intermediate / processed representation of boundary shapes for its locator shapes. These are still pretty high res, but not at their max resolution.
This approach assumes that there is always an administrative entity on the other side of a boundary, which would seem to fail for any number of historical use cases including expansive empires and ranges of indigenous peoples, or – more pragmatically – OHM mappers just not getting to the other entity yet.
For sure, but I wasn’t considering rasterized slippy maps as web maps. I meant things like Google, Bing, Apple, etc. I’m also focused on less technically correct-focused mapmakers like the creators of these maps.
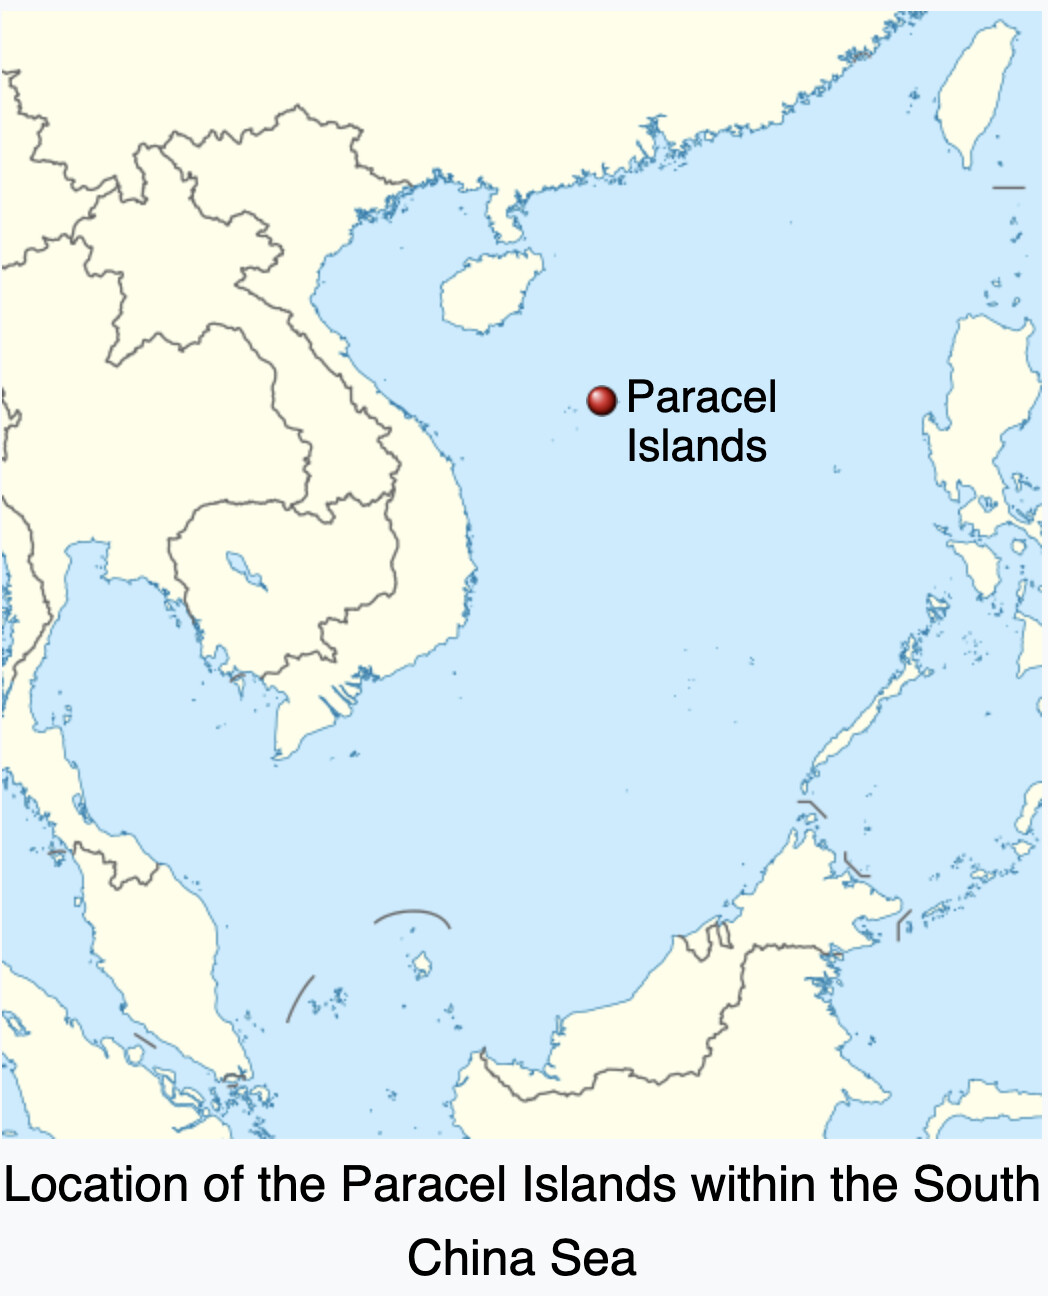
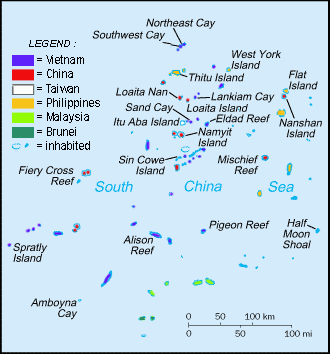
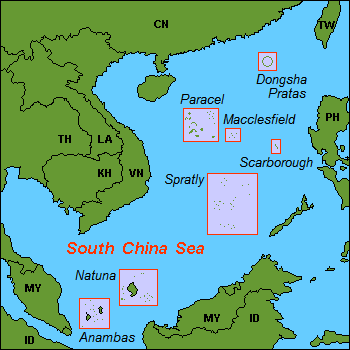
Yes, but those lines aren’t truly mandatory, as evidenced by locator maps and other maps on Wikipedia for the Paracel, Spratley, and Pratas Islands do not include these lines.
I think what I’m trying to focus on here is enabling data consumers to obtain shapes that match their mental image of the land of a territory (as described in the original post). This is a data consumer-focused question in addition to the cartographic representation on our primary map layers. I’m hoping we can figure out a way to serve those needs, although I could see an argument that maybe that’s not what we’re here for. Providing only options that include maritime boundaries seems like a miss, even for those cases where the governments of a country or land being depicted would prefer their maritime boundaries be included.
I think this would be fine, especially if they don’t have an interest in the changes in the maritime boundaries. I’m interested, but I’m not sure we should force those only interested in the land to take additional processing steps. I think we should definitely have those maritime changes in OHM and also have the land-only locator stuff in the separate source loosely described above.
I definitely don’t think we should use the Newberry dataset as any sort of guide here, not only for the reasons you mention, but also because we should have a data source neutral / agnostic approach to how we handle data in OHM. Nor do I think we should read too much into the choices made in creating the Newberry dataset, as their other challenges in creating the dataset were much larger and daunting.
Yes, but the need for high-member count relations is independent of the use of coastlines, although boundaries that follow rivers do tend to drive that count up. See a remnant of the Louisiana Purchase with no coastline and over 400 members. I’m hoping we can trust machines to manage these objects and mappers not to break them too often.
It seems like this is a critical step for rendering/not rendering boundary relations that include maritime segments. (should this one be tagged?)
So… here’s a summary of what I’ve taken away from the discussion so far. Please advise / adjust where I’ve gone wrong:
In OHM, non coastline over water boundary segments should be tagged with maritime=yes. This is critical.
We probably don’t need / want to render coastline-hugging boundary segments with border styling for any number of reasons - changing shorelines, questionable decisions about when to cut off rivers, bays, the need to add additional islands to numerous relations, etc. Tagging ways with maritime=yes will help make this possible. We should pursue this with OHM cartographers. But… how do we handle all of those issues for the same entities prior to the existence of official maritime boundaries? Even the “3 mile limit” isn’t that old. Should we create an arbitrary & fake construct (e.g. that the 3 mile limit has existed unofficially since the dawn of time) for the ease of our own sanity and data management?
Primary / canonical boundary relations in OHM should include maritime boundaries when they exist.
A secondary source (method tbd) needs to be created to provide land-only representations of entities in OHM for use in locator maps and for other purposes. In the meantime, more savvy consumers could still create land-only shapes using their own processing of the maritime-boundary-inclusive OHM relations.
What is less clear to me is whether we would still want to have relations that describe territorial waters as some sort of polygon or even a line. For example, would anyone ever want to be able to search for just the territorial waters of a country or of an indigenous people?
To reiterate, without nontrivial improvements to our software stack, we probably won’t be able to store the United States boundary as a single relation with direct member ways as we refine the Alaska coast and simultaneously refine our time series data. We’d be running up against hard limits. I think having to represent the United States as a collection of individual state and territorial boundaries would be just as unsatisfying as it is today with the absence of a comprehensive U.S. boundary relation.
I understand the motivation, but there’s some danger in providing shortcuts by default. From a pedagogical standpoint, it’s problematic enough that we’ve inherited the Web Mercator projection from the OSM software ecosystem. (Our migration away from Mapbox puts a solution to that out of reach for the time being.) Anyways, it’s not as if we’re the first project to include maritime boundaries. The tools exist to process OSM data for your intended use case, so naturally they exist for OHM as well. We can do more to document these possibilities.
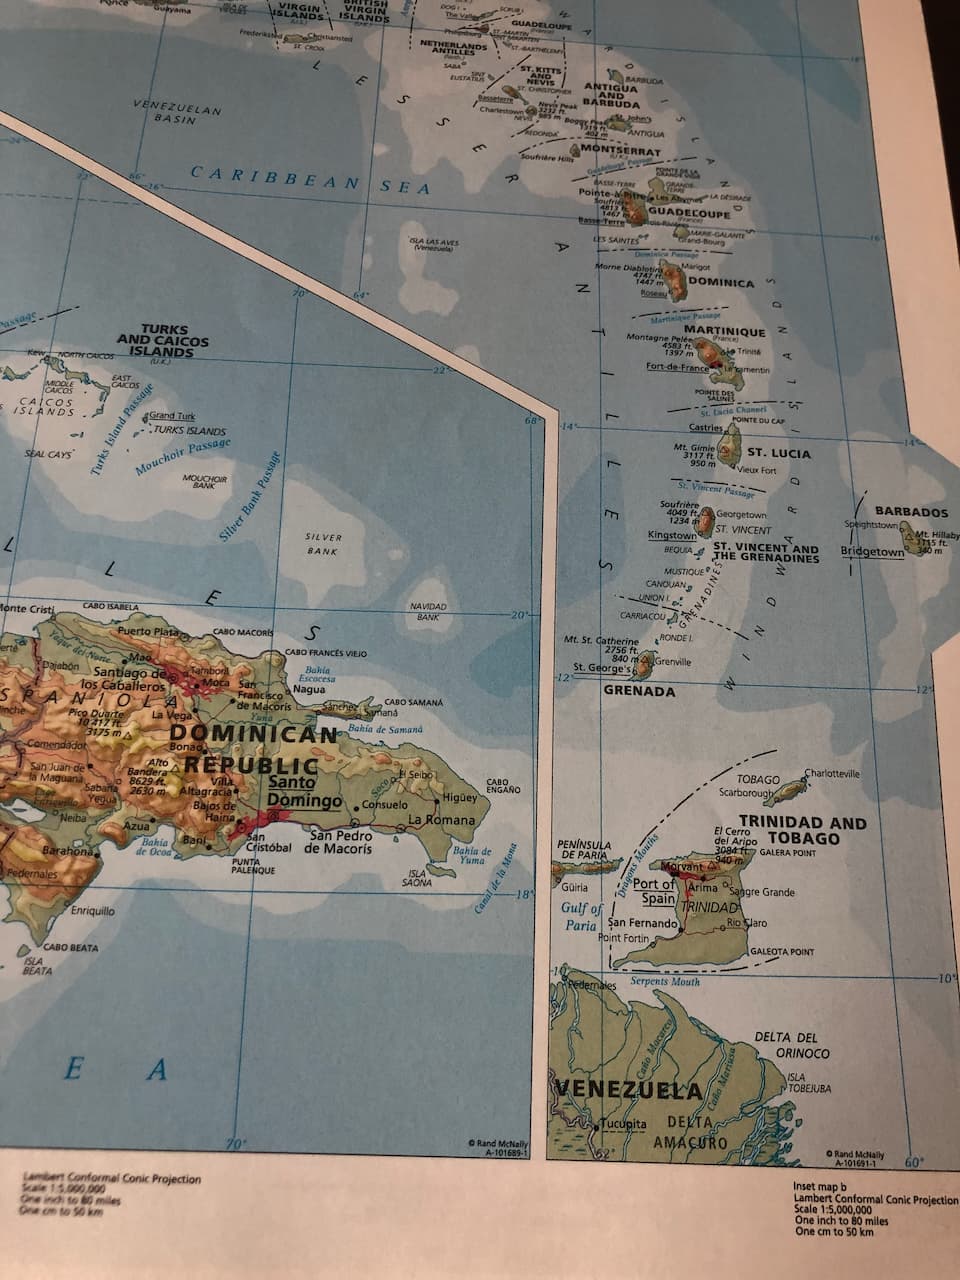
If we go by a literal interpretation of the definition of maritime=yes, then yes, it would have that tag. It might just be an oversight, or perhaps someone wanted to emulate the divider lines (or whatever they’re called) that some maps extend across territorial waters to disambiguate barrier islands and archipelagos. Compare the legally accurate boundaries on this Wikimedia Commons map of the West Indies with Goode’s World Atlas (22nd ed., 2010):
I don’t think these idealized lines belong in the database in cases where we have more accurate information, since they don’t necessarily hew to boundaries of any kind. Typically a desktop cartographer would draw them in manually using a Bézier curve tool in postprocessing. In our context, that would mean a stylesheet compositing a GeoJSON feature collection of hand-curated lines, something that many OSM-based maps already do for labeling bodies of water.
I think the answer will depend on the jurisdiction. In the U.S., under common law, a jurisdiction only included any territorial waters if you could stand on one shore and see the other – a principle that certainly applies to many of the harbors and bays that the Newberry Library fudged, but not to the Great Lakes or seacoasts. However, until United States v. California in 1947, states were presumed to have territorial waters via their enabling laws. A 3-nautical-mile limit was written into the charters of the Thirteen Colonies and the California State Constitution. Other Spanish-influenced states and territories went out to 9 nmi.
In the Great Lakes, the states had references to lakeward boundaries written into their constitutions. This was at issue in the War of 1812 and Toledo War. Some conflicting state claims persisted until 1947. For this reason, I tentatively kept boundaries hugging the shoreline until then. It would probably be more correct to, for example, map the overlapping Michigan and Wisconsin claims through Green Bay, or give the overlap to Wisconsin since they had de facto control the whole time. Where the boundaries were less well-defined, we could alternatively sketch in a crude indefinite=yes boundary way separate from the definite boundary way that exists today. That’s what mapmakers have been doing for centuries.
In civil law jurisdictions, I honestly have no idea about the default offshore status before the 20th century. It could be even better documented than in common law jurisdictions, but I wouldn’t know. @Bauer33333, do you know if the legal situation in continental Europe was anything like in English-influenced jurisdictions?
Natural Earth is already pretty good for this purpose in the present day; I think that’s what we’re currently using for the main map. Apart from that, we haven’t stood up OSM’s coastline mechanism, which would enable mappers to override this data at higher zoom levels (or in earlier time periods) using more accurate, precise natural=coastline ways.
There are many use cases for visualizing part of a bounded territory. Many historical boundary datasets represent parcels or annexations, rather than the unions of those geometries as we do. Our approach is optimized for common use cases, but sometimes it becomes necessary to talk about a particular portion of a territory. For example, the Gadsden Purchase was never a territory per se, but every U.S. history textbook discusses it, so it makes sense to represent it as an area feature, even though we don’t afford the same treatment to every other territorial expansion of the U.S.
I haven’t come across an example of a U.S. county or state whose territorial waters per se are significant enough to map separately, but there are some examples of this internationally. OSM would map it as a boundary=maritime area if it has a common name among laypeople, not just in historiography or political science.
In any event, I think it’s pretty clear that a next step would be to apply maritime=yes to the lakeward and seaward boundaries that we have so far, then plumb that tag through to the stylesheets. I’ll be a little disappointed that we won’t be able to catch visitors’ attention with the suddenly changing coastal boundaries across the U.S. in 1947, but maybe we can revisit it as part of togglable layers or somesuch.
Hmmm… per #3 above, I’m suggesting we not provide them by default:
and per #4 above, I’m suggesting the shortcuts be handled outside of the mainline OHM:
I wondered this, too!
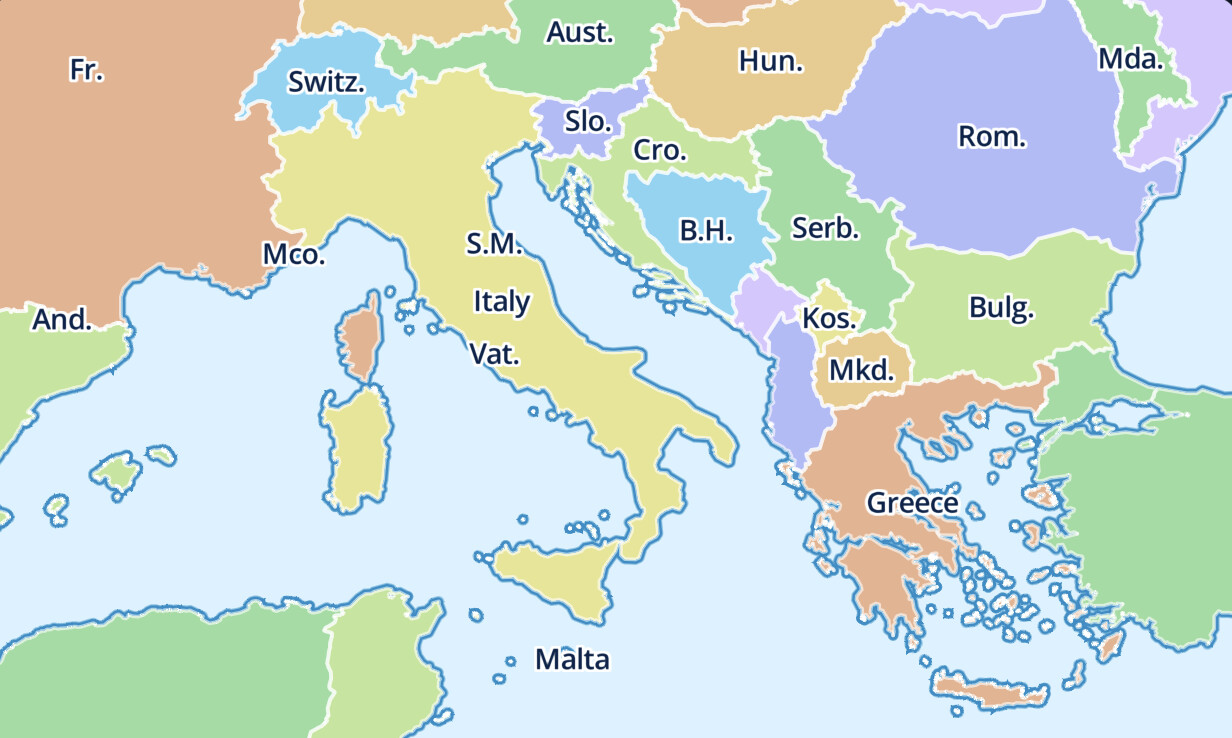
My question is for where there is no historical jurisdiction or common law precedent. Imagine pre-14th century history. The oldest reference I could find in my quick and lazy search was to the 1635 Mare Clausum by John Selden. It would sure be convenient not to have to manage the Greek shorelines and archipelago for Greek empire relations, no?
No doubt. Not trying to repeat what they’ve done for the present day. And, I was hoping to get into too deep of thought about “how to” do the processing. But! I could see using NED shorelines to clip the coastal shapes in OHM and to simplify the rest of the OHM boundaries to match the scale of the NED coasts to get a decent first cut. That way, we could avoid any OHM shoreline issues altogether. Or, mostly.
Seems like something we could include with some nice treatment in our main map, no?
It sure would. Even more recently, there are probably regions where such questions would be utterly moot. I think this touches on the question of whether we should even represent boundaries strictly as areas. It’s a bit of a can of worms.
Can’t help you on that, I’m so far from the sea that I never had any contact with these issues.
But iirc we didn’t base them on sight distance but on how far something could be out and you could still shoot it.
I see that you’ve started to tag some overwater boundary ways with maritime=yes. Thanks for considering this approach. I think stylesheet authors will appreciate this extra flexibility, though I want to be clear that it’s only a compromise that won’t accomplish all that you’d like cartographically.
I think it goes without saying that, if a boundary runs through an inland body of water, such as a lake, it probably shouldn’t be tagged maritime=yes. But what about the Great Lakes? They’re huge but still lakes. I’m not sure that this Illinois–Michigan line in Lake Michigan should have maritime=yes, which was designed for the international law concept of a maritime boundary.
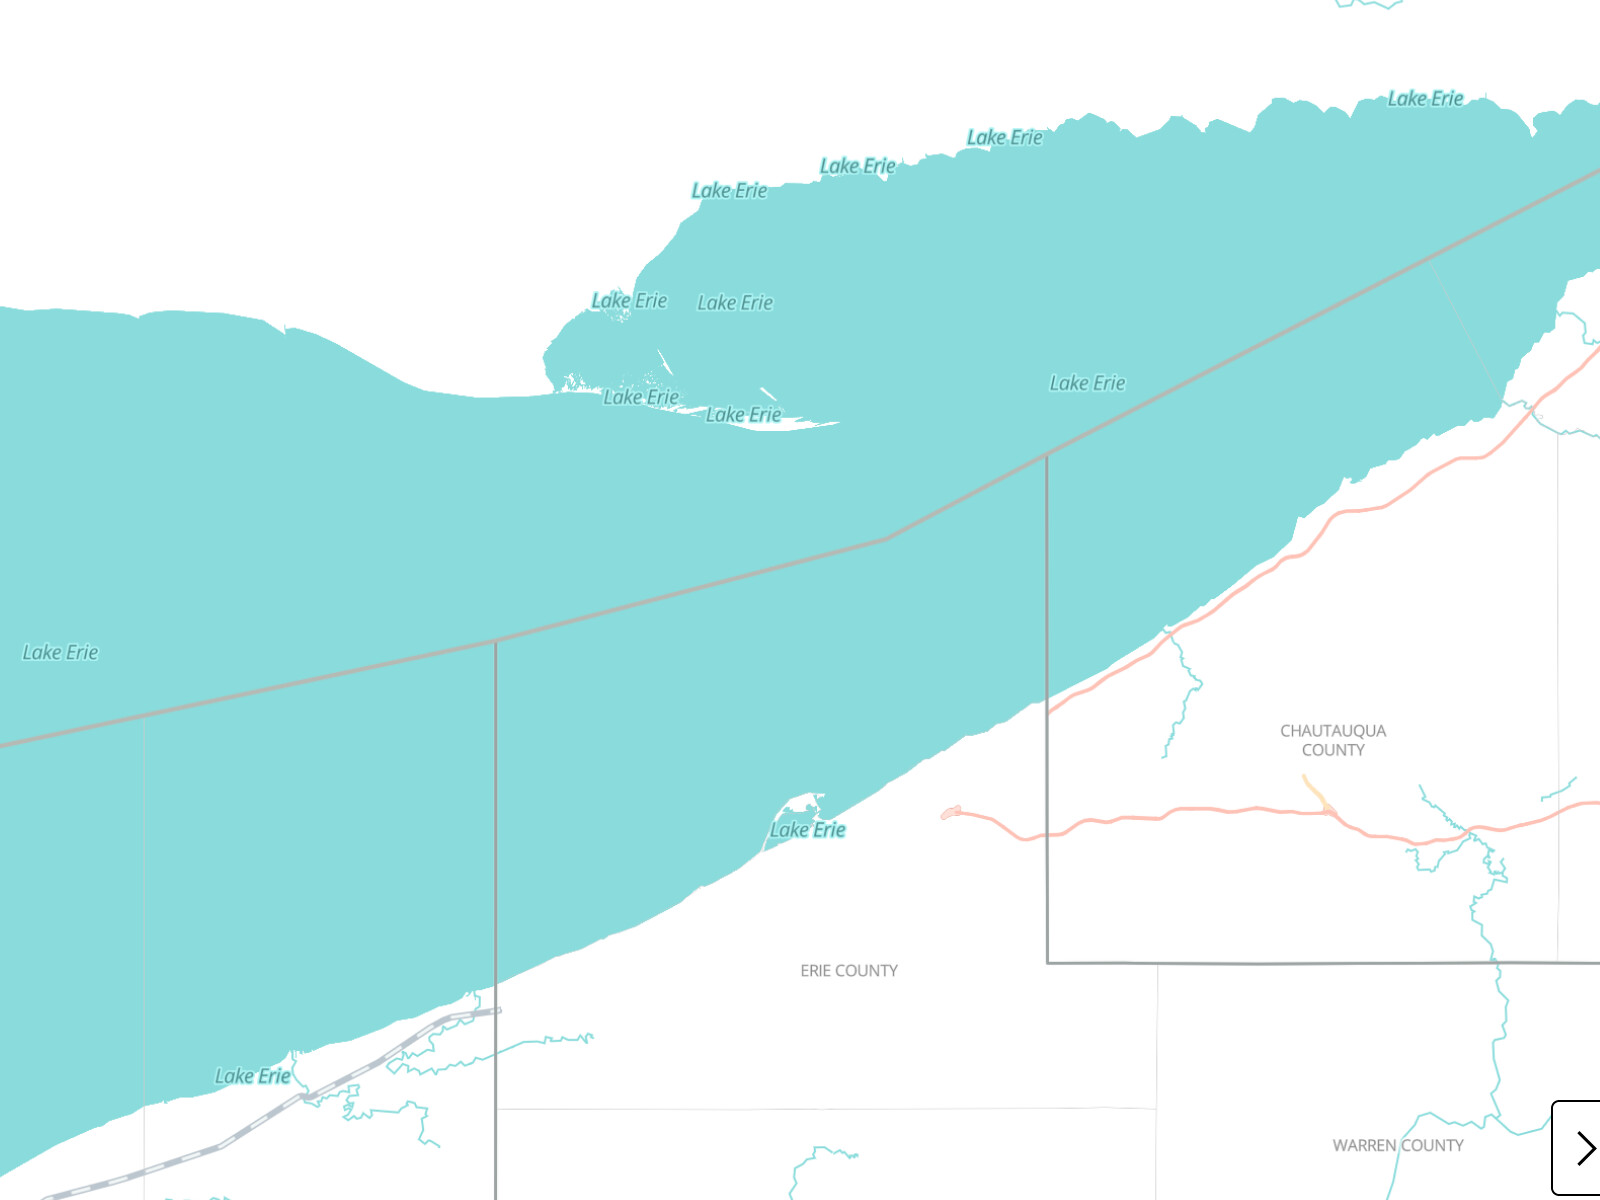
Imagine if we chose to hide some boundaries in the Great Lakes. Then the two north–south lines that bound the Erie Triangle of Pennsylvania would appear to end at the lakeshore, not connected to any other boundary line, and stopping short of the international boundary with Canada. Or if we decided to hide even the international boundary, then it becomes less clear where one country begins and the other ends. Lake St. Clair would look quite awkward.
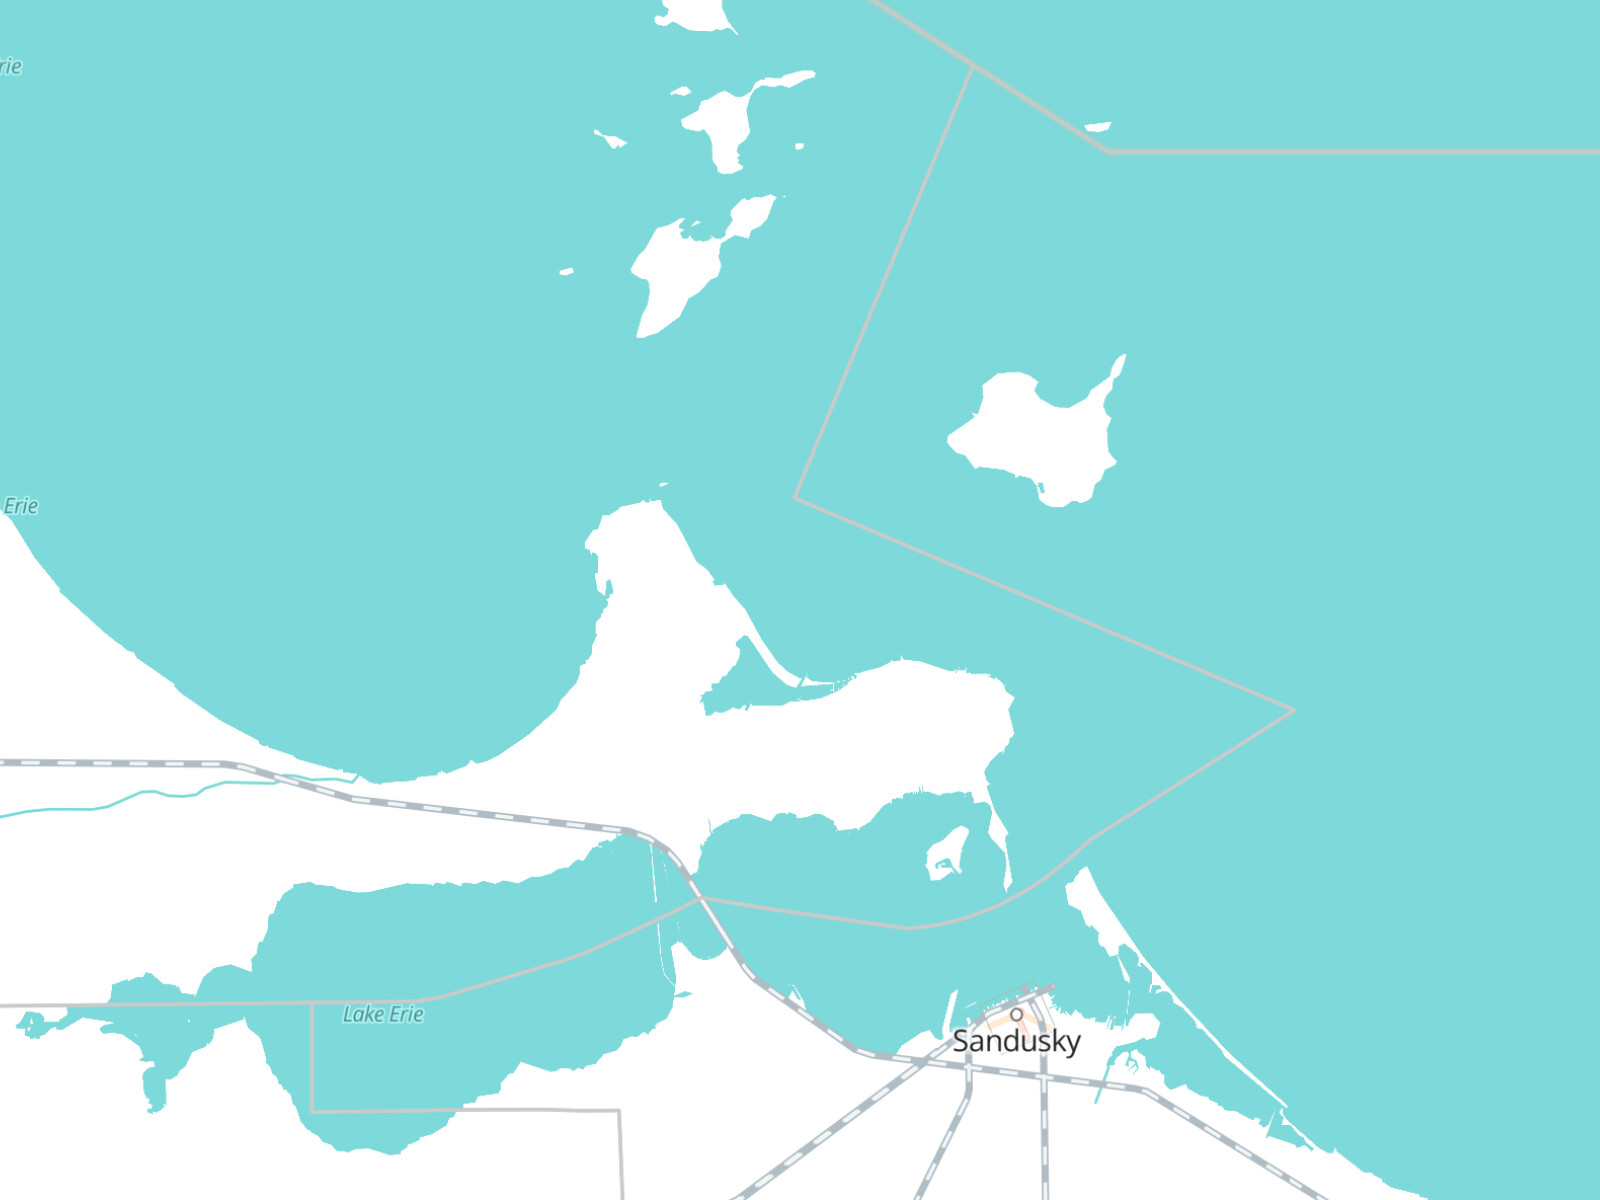
If any map hides the Erie–Ottawa county line, Kelleys Island looks like it might belong to the same county as the Bass Islands and Sandusky Peninsula, even though the county line splits down the middle. This particular jog in the line has been the subject of some back and forth, as island residents changed their minds about which mainlanders best represented their interests:
Most political, topographic, and transportation maps show the national boundaries in the Great Lakes, and many show state and even county lines. Those that hide the lakeward state lines get away with it by giving state lines a very different visual treatment than the international border. For these maps, state lines are of secondary importance at best. Only choropleth maps consistently hide these boundaries, but we aren’t making choropleths.
My preference remains to show all the boundaries and let readers suffer the burden of learning what they represent. I’d be much more interested in distinguishing indefinite and disputed boundaries so we can style them differently. But I recognize that this may just be my bias from having lived in a state where boundaries over water mean something.
Good call on the inland overwater boundaries. I’m game for whatever, even if I think we’ll still have plenty of users who want land-only polygons. We’ll figure out how to get those, I’m sure; although I was glad to see that even the smart people at MapLibre had cheated around this as well, with their limited zoom or wide border styling on their demo…
That demo style uses OpenMapTiles, the same tileset I cited earlier as a consumer of maritime=yes. But it’s also a good example of a style that literally places the water layer over the boundary layer to ensure that boundaries never appear over any kind of water. It works great for political maps that show only a limited number of data layers. For example, this style omits inland waterways and waterbodies. It also omits anything that you might want to show above water but below boundaries, such as roads.
We should make sure the stylesheets distinguish the various levels of administrative boundaries, and that administrative boundaries look sufficiently distinct from other linear features like roads and railroads. Another treatment that helps is boundary edge labels. OpenMapTiles and MapLibre sort of support edge labels, but it’s rough and incomplete. We would want to show edge labels in the Great Lakes, but definitely not out at sea.
I’ve been thinking about this note. Can you add some more background for me (& others)? Is this related solely to the size of each relation (e.g. number of members) and the number of different versions of this relation? i.e., 3,000 members per relation times 50 similar relations? Is the load just generating the shapes or requiring all of the different relations for the US having to be loaded into every tile in the pyramid for the entire United States?
I think having an understanding of this scaling dynamic and strain across the community would be a good thing to have, esp. as we think about tradeoffs in temporal resolution.
For example, if the US ceded territorial claims to a few islands off the coast of Maine after the War of 1812, what’s the best way to handle that? Changing the entire continental US relation or creating an incremental or delta relation as you hinted earlier? This might be a better discussion in a different thread, but I think it’s worth group review.
I’m assuming that the Tongass National Forest relation in OSM is a more accurate representation of how many islands there are off the coast of peninsular Alaska than what the Newberry Library dataset contains. I spent some time with its coverage of Alaska and had to add some rather significant islands that they had omitted. The Tongass amounts to 29,000 member ways where we currently have only 714, leaving only 3,000 ways for the remainder of the Alaska coast and all the rest of the U.S. coastline before we’d hit the API limit of 32,000 members per relation.
This limit was introduced after someone accidentally grew a New York City bus route, making the Tongass look like a city park by comparison and breaking some prominent data consumers. The concern was that someone could accidentally or intentionally bring down a significant portion of the OSM ecosystem just by hitting paste a few times in JOSM.
Again, I’d rather that we make the tools more robust than oversimplify the map, but we should have a good reason grounded in faithfully representing the real world.
Yes, copy the entire national boundary and tweak that little bit. As precedent, several of the Eastern and Central Time Zone boundaries represent hyperlocal changes to city limits that the time zone boundary was based on. I expect the chronologies to grow over time as we map the boundaries of more of the border towns and detail the countless realignments in the Cincinnati Southern Railroad that also formed a major part of the boundary.
The alternative would be to map boundaries as collections of annexation areas. But even the handful of historically significant annexations you’ve mapped came with changes to the affected boundaries. There’d be no sense in mapping “the United States, 1994 to present, minus the Louisiana Purchase”.
I forgot to mention that admin_level=* applies to these boundary ways as well. Use the most important (numerically lowest) value of all the boundaries that incorporate the way. Otherwise, a renderer wouldn’t know whether to treat it like the territorial waters of a country, state/province, county, etc. (and some places make distinctions between all of these levels at sea).
No, just set admin_level to the numerically lower value of the two boundaries. This is a holdover from when OSM used to only tag admin_level on the member ways of a boundary.
It looks like you’ve since deleted this relation, so there are now two unrelated states of Illinois. Are you still interested in pursuing a lakeless Illinois, or should the two relations be consolidated?
I just see one state relation and one state territorial water relation, where’s the second state?
Seriously, yes, they should be consolidated.
Based on the feedback on this thread, it didn’t seem like the separate approach was catching on and I deleted the parent of those two when I was filtering on some other stuff.
I’ve been working along the coastal states first, establishing a baseline 3nm boundary, and just haven’t gotten to:
Changing US maritime boundaries through history
Great Lakes
County coastal boundaries (this may be left as a checklist on the project page)
But, it is focused primarily on the US & on the fringes, has some mistakes.
Florida’s Gulf coast and Texas are notable, in that they both have 9nm (3 league) maritime boundaries, but in digging into the details, it appears the NOAA site has some mistakes. In particular:
Florida & Texas regained their 3 league maritime boundaries in separate Supreme Court cases in 1960: 363 U.S. 121 - US v Florida & US v Louisiana, 363 U.S. 1. So, from the SL Act of 1953 until 1960, the official US view was that the state waters only went to 3nm.
Florida’s 3 league boundary was not actually from Florida’s Constitution when Florida was admitted to the Union, in 1838, but when they were readmitted to the Union in 1868. The constitution of East Florida (1812) said nothing about territorial waters, either. So, Florida’s territorial waters are inadvertent (imo) spoils of the Civil War.
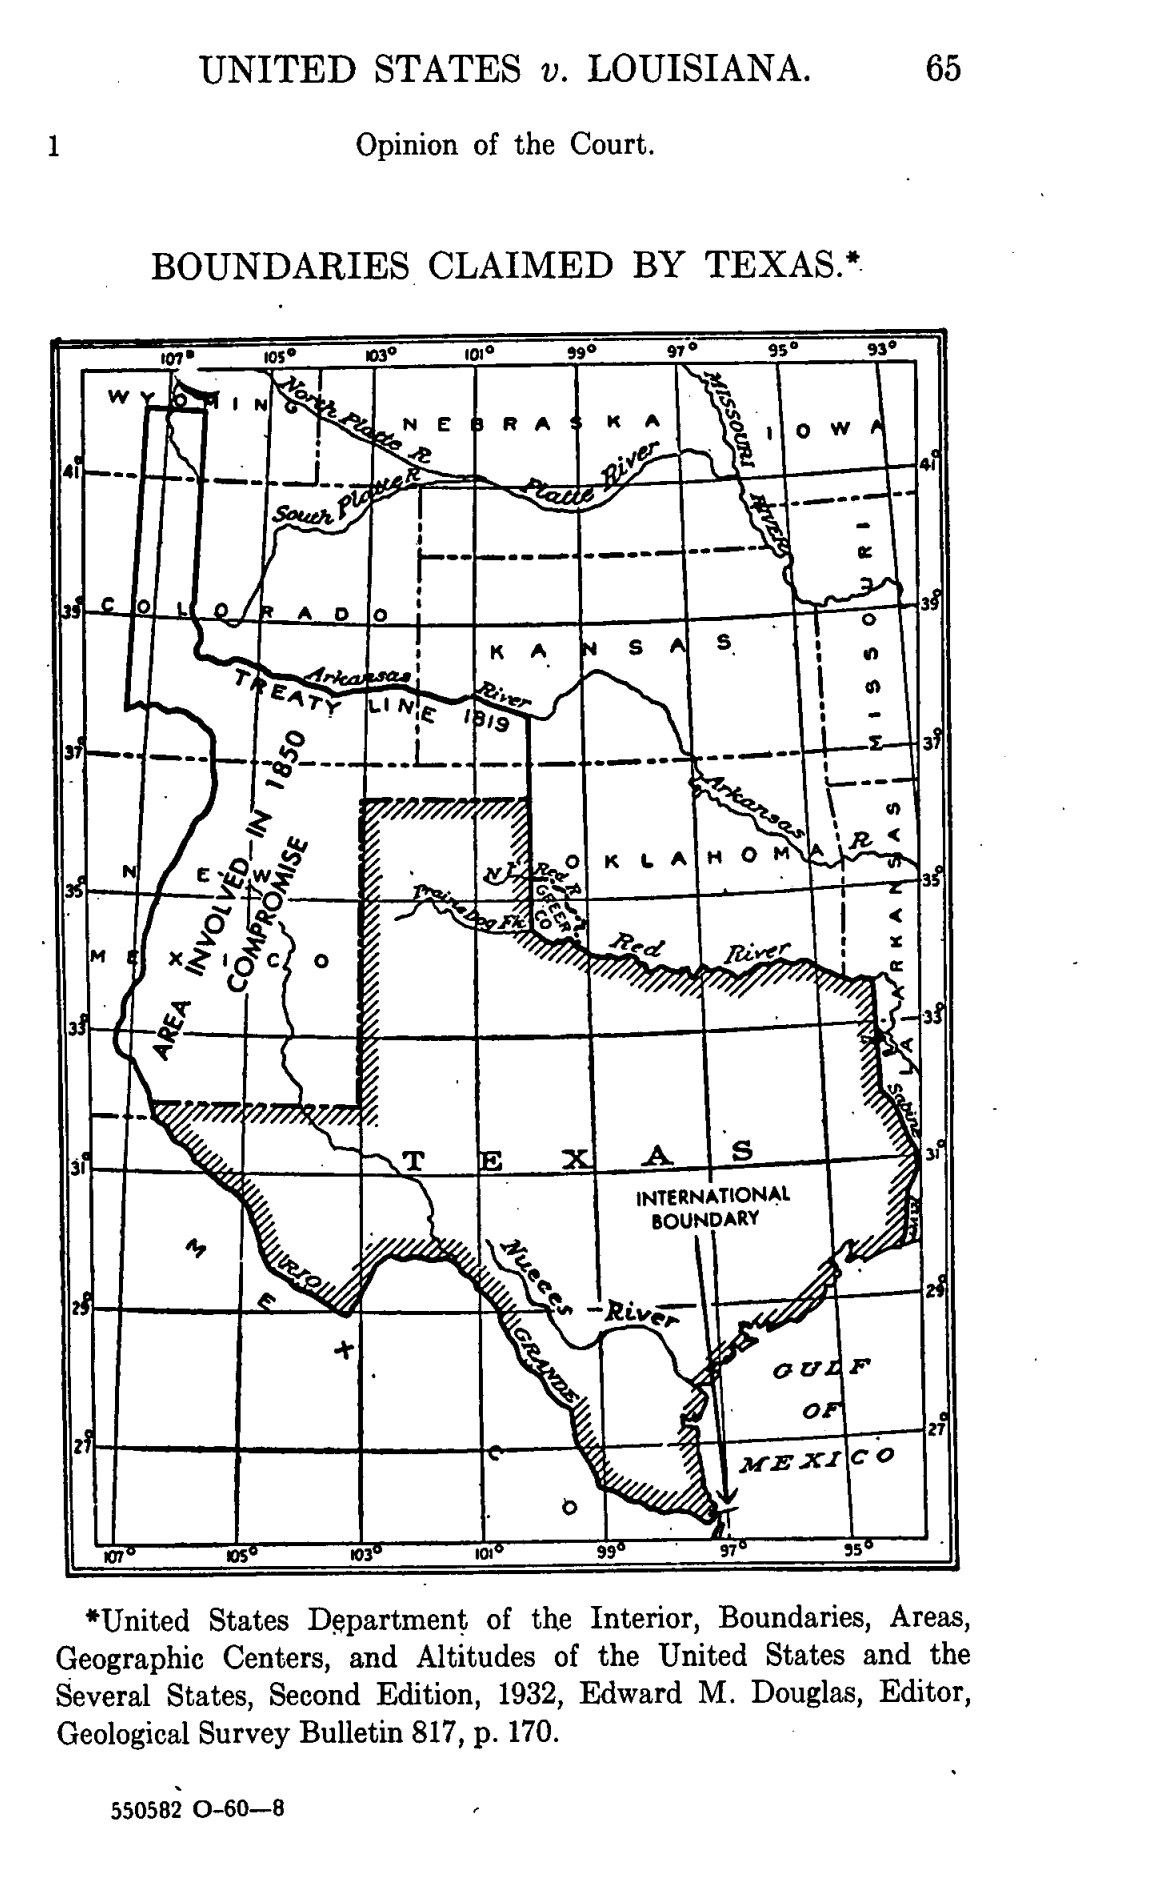
Texas’ 3 league boundary is from neither the Constitution of the Republic of Texas (1836) nor the Constitution of Texas (1845), as implied by the decision in US v Louisiana (1960), but as part of a Texas law that was accepted in some way shape or form when Texas was originally admitted to the Union in 1845, and the force of which the SCOTUS opinion validates in a deep dive that involves the Treaty of Paris, principles of national sovereignty, relations with Spain and Mexico, and on and on. I was very excited by a reference to a map of Texas’ boundaries in a text-only version of an opinion about maritime boundaries, but was disappointed only to find this in the original. que sera!
Here’s a quick timeline (which may be rife with errors) of US territorial water claims:
1776-1947: US & states: 3nm everywhere except Texas & Florida’s Gulf Coast, which were 9nm (3 leagues) and some of Florida’s very Southern border. In general, this is more by claim than specific statute the farther back you go during this period.
1953: Submerged Lands Act - Congress passes law restoring 3nm maritime boundary to all states (including Texas and Florida, both of which were not happy)
1960: In 2 separate cases (above), for separate reasons, SCOTUS restores 9nm maritime boundaries along Texas and Florida Gulf Coast to those states and the US
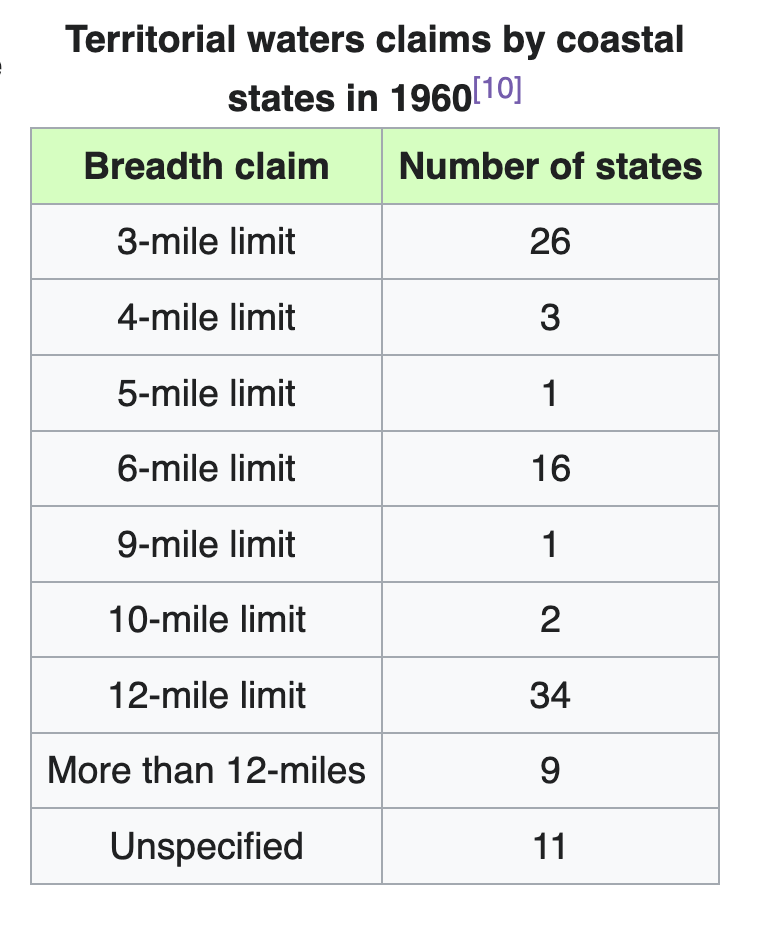
1982: UN passes law of the sea suggesting 12nm as appropriate national territorial limit for all countries - many were already doing this
1988: US extends its federal territorial waters to 12nm
1994: provisions of 1982 UN Law of the Sea come into effect
These 2 shapefiles are most helpful when mapping state and federal limits:
Submerged Lands - (Continental US only…) - this is the 3nm/9nm line for US states
Again, the specifics of this post only apply to the United States, and the claims of other countries vary both in distances and timelines, so we should be sure to follow appropriate claims for each entity throughout history.
