Hey there, I’m Alex; brand new to OpenHistoricalMaps but have found the learning curve fairly gentle. I’ll save my gripes about the web editor UI and wiki usability. ; )
I don’t have strong opinions on what should be done, being so new, but I am testing OHM as a platform for the fans of a particular show on Mexican history. There is a podcast in Spanish: “La Verdadera Historia de Mexico”, which has now a rich library of podcasts and is an amazing resource of knowledge, I sent an email showing them a prototype map to see if they like the idea / and if they know fans that want / do some thing similar.
I meandered into uMap yesterday as a quick and dirty place to show the key events in one of the episodes and was largely impressed by its simplicity and intuitiveness. Then I found this Library of Congress which was sort of what I wanted to do, but still wanted more richness
Tragic Ten Days Interactive Map - The Mexican Revolution and the United States | Exhibitions - Library of Congress with captions, archival image popups! Never satisfied, alas!
Today I managed to use Map Warper to take a Lib of Congress map and make a baselayer of it to put on uMap.
There on my uMap:
I stored various events as points with labels, popups, tags, and explanatory icons about the building or movement of people.
Layers can help separate the days e.g. that comprise the 10 days of political maneuvering, violence and chaos, called the “Decena Trágica”, a pivotal turning point in the Mexican Revolution, precipitated by people who wanted (more) money and power.
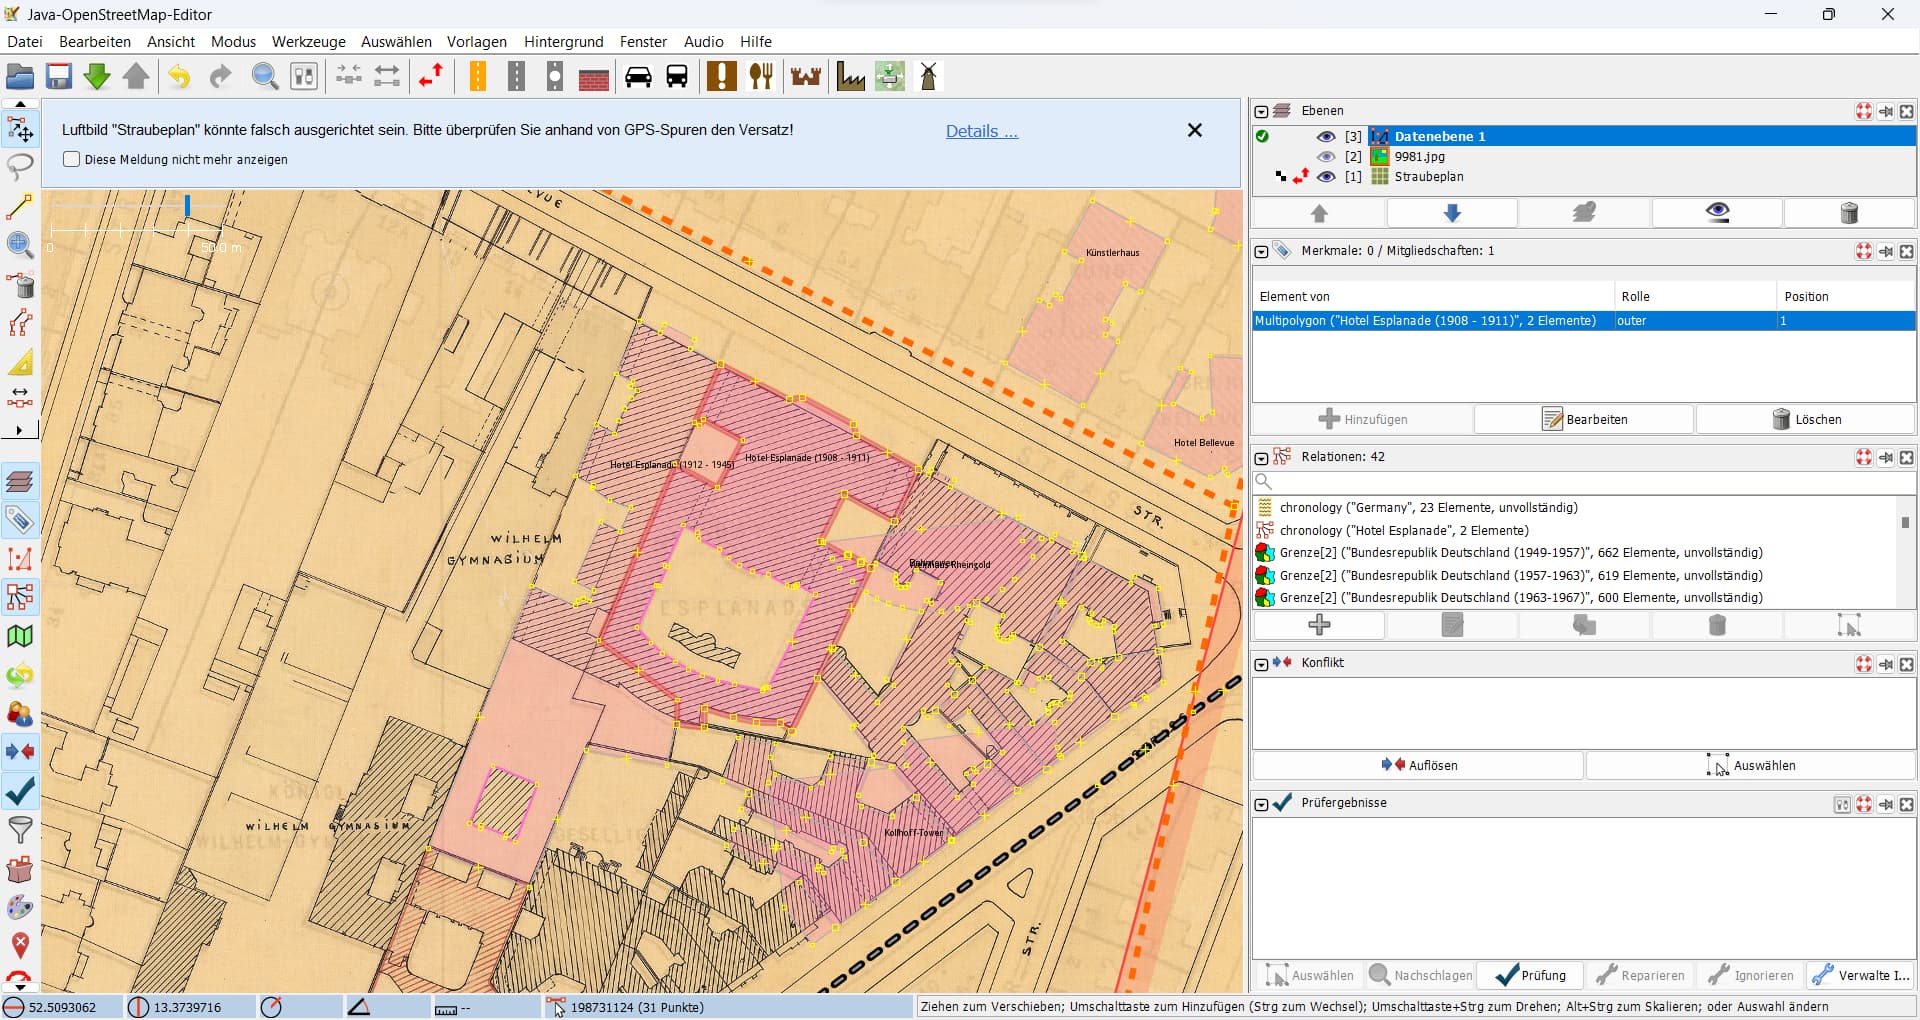
Today I added a building called “La ciudadela” in OHM where lots of stuff went down. Not yet done!
My question after all this is: should I plug my source data from the podcast info into OHM to continue building on it with the show fans, ideally?
Publishing clear workflows and prescriptions for the use case / historical themes, and demo visualization options would be great!. Then, that takes pressure off OHM being the one stop shop for data and visualization.
My pending question as newb user: With all the data I might have in this podcast, how can I programmatically prep all of it for easy entry / verification? How can I organize this data by themes and allow others to check it? These are some of my questions, I think you gurus have some tips on or might be good material for socials! Hope to meet some of you at OSM conf in a week! Also, check out Viz for Social Good ~I like their format of soliciting ideas from NGOs and having the masses take a hack at visualization ideas for the statistical data they offer.