Last week, the development team deployed another update to the software that runs the site and API. Lately, we’ve been prioritizing somewhat less glamorous changes to support the site’s performance and reliability and it’s starting to yield tangible results. Hopefully, this will make the project a little more captivating for you.
Performing in front of an audience
Yeah, we know, the slippy map on the homepage is slow. Our rendering performance gets bad enough that, when an influencer recently showed up on TikTok hawking OldMapsOnline, one of the first comments countered that OHM is more accurate… but so laggy. These Gen-Zers think we’ve got a millennial pause. ![]()
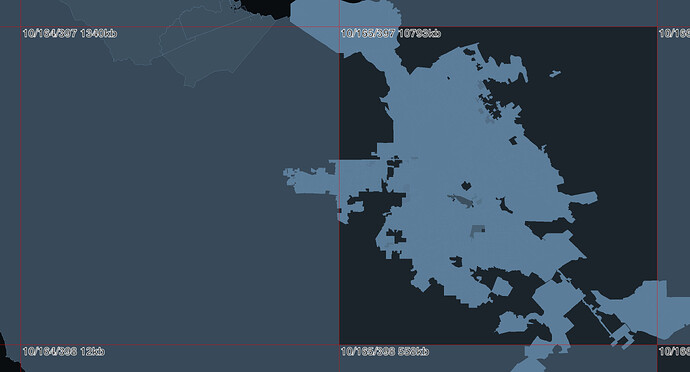
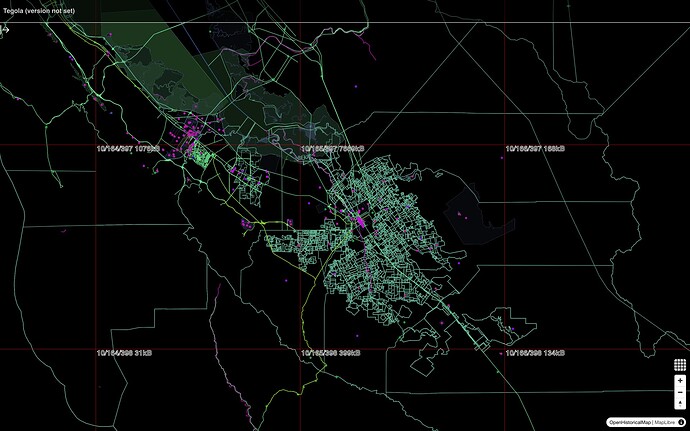
I have to admit, they have a point. For a while now, if you’ve zoomed into my hometown of San José, California, you would’ve had to wait a long time to see anything. Looking at the vector tile inspector, it’s easy to see why: the relevant vector tiles contained every single one of the city’s 1,172 boundaries since 1777 at full resolution, enough that some tiles were more than 20 times the maximum size supported by MapLibre GL JS, the map rendering engine we’re using. This has also been a longstanding problem in other places like Central Europe where we have many centuries’ worth of complex, unrelated historical boundaries.
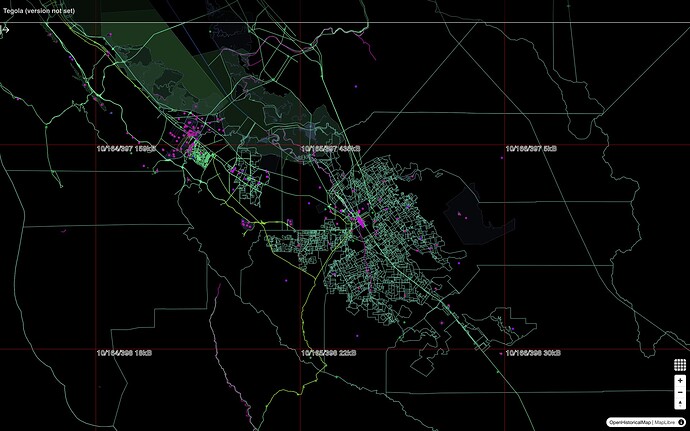
Fortunately, there was some low-hanging fruit for optimizing the tile sizes. At zoom level 9 (vector z10), you don’t really need to see centimeter-level detail. Last year, we drastically reduced tile sizes by simplifying geometries by an imperceptible amount. Then, in December, we converted all the boundary polygons to linear features along the boundaries’ member ways, as part of generating centroid points automatically. These optimizations shaved 29% off the size of the z10 San José tile, but there was still more room for improvement. Every time any part of San José’s boundary changed, there was a redundant linear feature over each of the other parts of the boundary. This added tremendous bloat for no good reason.
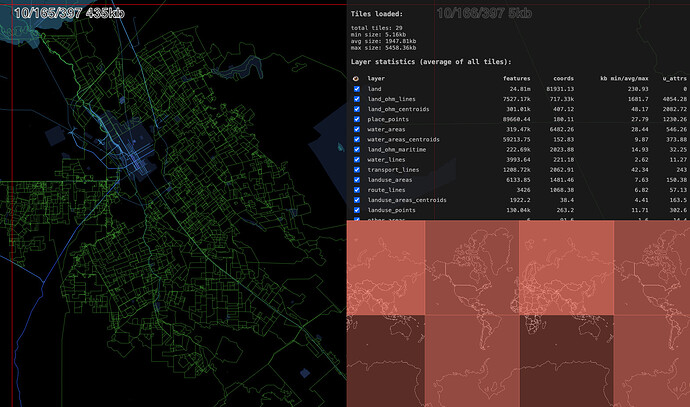
As of last week, we’re deduplicating these lines, coalescing any that are identical in space and adjacent in time without any gap in between. We also moved landmasses to a separate tile endpoint, so that the browser can cache this static content more aggressively. These optimizations reduced the z10 San José tile by another 94% to just 435 kilobytes, for a total size savings of 96%, even as we continue to fill in lots of non-boundary features in the area. For a sense of perspective, this is less than four times the corresponding OpenMapTiles/Planetiler vector tile from OpenStreetMap U.S. (116 kB) and about ten times the corresponding “Standard” OpenStreetMap Carto raster tile (41.19 kB), despite containing centuries’ worth of history.
Although I’m picking on San José here, these improvements benefit almost every part of the globe to varying degrees. This should give us more breathing room to map local detail without incurring agonizing wait times and hopefully without any perceptible change. And the time slider’s time lapses should animate more smoothly than before.
We’re continuing to investigate other areas where our performance needs improvement. For example, we want to cache globetrotting changesets more aggressively. Our coverage of national and imperial boundaries is much less stable than OSM’s national boundaries, so this should minimize the time you wait for a tile to get regenerated just because of a boundary change very far away.
Free styling in the alley
Several subtle but significant changes made it into the latest version of the Historical stylesheet. Service roads like alleys and driveways are thinner than residential roads, so they no longer clutter up urban areas as much. Subways appear earlier at zoom level 12 (vector z13), befitting their importance in the transportation network of cities like New York and London. Swimming pools show up, just in time for warm weather in the Northern Hemisphere.
If you’re developing a Web or Node.js project that incorporates our featured stylesheets, you can include them via a new NPM package instead of having to hard-code the stylesheet URL. We don’t expect to break the current stylesheet URLs, but this package can ensure that you get the very latest deployment version of the stylesheets.
This package joins maplibre-gl-dates, another NPM package that implements date filtering according to OHM’s interpretation of start_date=* and end_date=* tags.
Roll credits
For the last couple years, @vanessa_GIN has been the main designer of our official styles. You’ve probably seen her around here soliciting design feedback, which she incorporated into a continuous evolution of the main Historical style. She also designed the playful Japanese Scroll and Woodblock styles and the more utilitarian Railway style. If you haven’t caught it yet, her talk at the 2022 NACIS annual conference shares how she did it:
Unfortunately, Vanessa had to step away from OHM last month. We’re so grateful for her contributions to the project and wish her all the best! Before she left, Vanessa wrote up design documents for the styles that will help us stay true to the design direction going forward.
As always, these software deployments are a team effort. Many thanks to @Rub21 and @erictheise for coordinating these performance and infrastructure improvements, and to @tsinn for picking up where Vanessa left off and knocking out a solid set of style improvements. Don’t forget: if you spot anything amiss, please get our attention here in this forum or in the central issue tracker. Or record yourself doing a jig on social media, as fast as you can.


