What is so special about 1824 that the default time span starts here?
Do we hide /make it difficult do discover/ events that happened just a few year earlier?
The time slider arbitrarily defaults to starting 200 years ago, but you can adjust the range using the input fields directly above the blue bar.
Until recently, the default start date was 100 years ago (1924). It’s a tradeoff: setting it earlier shows users that we’re interested in more than just recent history, which is good. But it increases the likelihood that the user stares at a blank map. After all, the current average year in the database is 1930. Including more years in the slider also decreases its precision (since the width remains unchanged), making it more difficult for the user to land on the year they want without typing it in manually.
In iD, there’s a little blue “chip” in the status bar that indicates how many features are currently hidden by the date filter or any other filter. Maybe we should introduce something like that to the main map, so the user knows there’s more than what meets the eye.
Even a feature from the last 200 years can be difficult to discover sometimes. Ideally the slider could mark the positions that have the most features or the most changes so you don’t have to hunt around for them.
2 Likes
What is iD?
How comes that more time has less historic features? I would suspect that more enabled years means less filtering means more items to be displayed on the map.
Yes, an empty-map situation is a real challenge.
But yes, it is a tradeoff. The granularity of the slides becomes less useful for 3k years. BTW For this very reason my timeframe control in Chronoscope is not linear. From 0* till 1500 it steps by 100s. After that it steps by decades or even years when the user is interested in exact adjustments. (* a lower limit of 0 means that all maps B.C. are available.)
Feel free to play with Chronoscope’s timeframe control at the bottom of this screen.
iD is the Web-based editor, the default option when you click the Edit button.
The time slider only displays a single point in time. The concern is only about the initial view as soon as you load the site; of course the user can always scrub the slider to hunt for more coverage.
Our coverage is currently heavily biased toward the 19th and 20th centuries for a variety of reasons: it’s easier to map things that still exist, particularly based on aerial imagery; rail mappers are inherently focused on this time period; and the U.S., a relatively young country, has seen large-scale imports of subnational boundaries. We want and expect this recentism to gradually shift further back in time as mappers discover a wider variety of sources and we attract more users who have more experience conducting historical research. But there’s always going to be some degree of recentism, because we generally know more details about the present than about the past.
Users can experience OHM data in other ways besides the single point in time exposed by the time slider. For example, when you query Overpass in Overpass turbo or Overpass Ultra, the map is unfiltered by default, so you see a comprehensive view of everything everywhere all at once. A developer could easily create a similar map that adjusts transparency based on a time slider rather than filtering anything out, for an “onion skinning” effect. The wiki portal has a scrubber that lets you compare two arbitrary dates, as well as a curated selection of mapped features by date rather than on a map.
This is a great idea. It would be a relatively straightforward UI change. That said, laypeople are generally unfamiliar with logarithmic and other nonlinear scales, especially when animated (one of the options provided by the time slider), so we’d need to provide both options. Another possibility we haven’t explored is to allow the slider to operate on a more granular scale the longer you hold down on it, similar to the behavior in some video editing software.
1 Like
ok, ic, thx for the clarification. I’ve updated my mental model (i.e. my understanding) of OHM’s date range controls. I’ve also updated Chronoscope’s algorithm when linking to OHM. Now I take my current map’s year and add +/- 50 years to set OHM’s daterange parameter. If Chronoscope has a time frame specified, I use that instead.
After all it is still very likely that the user just sees nothing in OHM. /my 2 cents
2 Likes
If anyone wants to set their own custom time range in Firefox, here’s how I’ve done it.
Create a new folder in your files, create 2 new files, manifest.json and script.js (They have to be named exactly that). After you’ve pasted the below code into the files and saved them, search about:debugging#/runtime/this-firefox in your browser, click on Load Temporary Addon and open the manifest file. Then just run reload and your website should always have the timeslider set to your custom values.
manifest.json
{
  "manifest_version": 2,
  "name": "OHM Year Setter",
  "version": "1.0",
  "permissions": ["*://www.openhistoricalmap.org/*"],
  "content_scripts": [
    {
      "matches": ["*://www.openhistoricalmap.org/*"],
      "js": ["script.js"]
    }
  ]
}
script.js
let rangeInput = document.querySelector('.leaflet-ohm-timeslider-rangeinputs-year');
if (rangeInput) {
    rangeInput.value = '1000'; // Replace with your desired year for the year range
    rangeInput.dispatchEvent(new Event('input', { bubbles: true }));
}

let submitDiv = document.querySelector('.leaflet-ohm-timeslider-rangeinputs-submit');
if (submitDiv) {
    let submitButton = submitDiv.querySelector('button, input[type="submit"]');
    if (submitButton) {
        submitButton.click();
    } else {
        console.error('No submit button found inside .leaflet-ohm-timeslider-rangeinputs-submit');
    }
} else {
    console.error('Submit div not found');
}

setTimeout(() => {
    let sliderInput = document.querySelector('.leaflet-ohm-timeslider-sliderbar');
    if (sliderInput) {
        sliderInput.value = '1300'; // Replace with your desired year to load
        sliderInput.dispatchEvent(new Event('input', { bubbles: true }));
    } else {
        console.error('Slider input .leaflet-ohm-timeslider-sliderbar not found');
    }
}, 1000); // 1-second delay to ensure submission completes
1 Like
Does this extension do something similar to setting the Range control in the time slider?
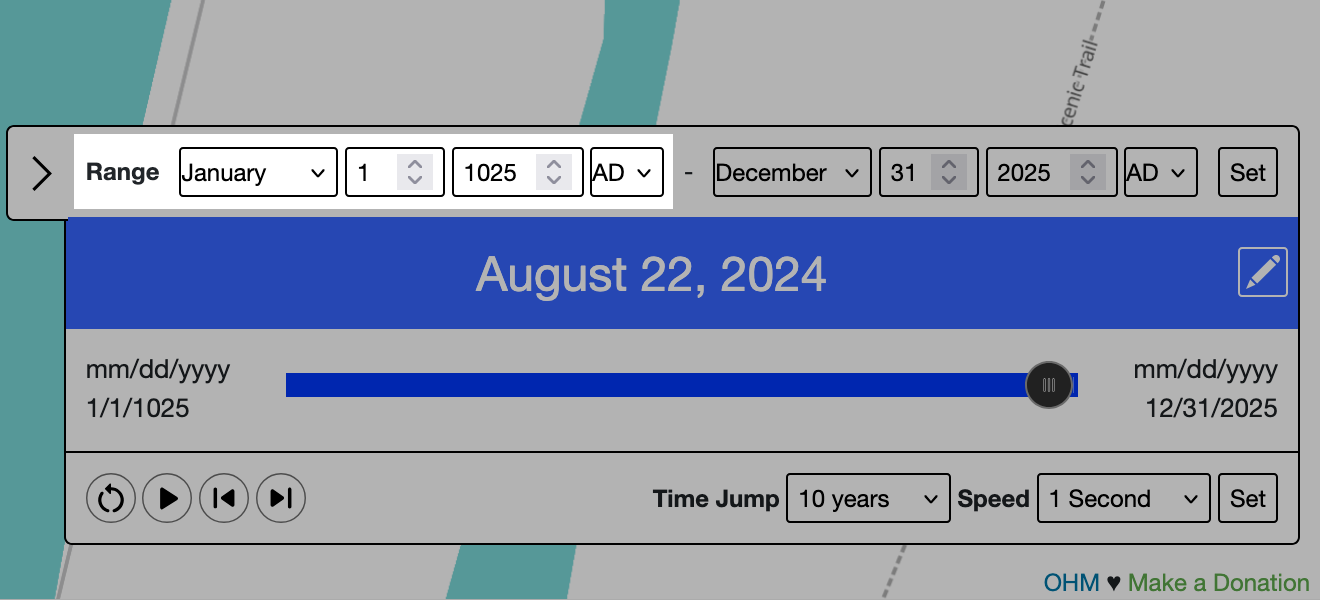
It defaults to 200 years ago, but you can change the default by setting the daterange= URL parameter, for example:
https://www.openhistoricalmap.org/#daterange=1025-01-01,2025-12-31
This isn’t as discoverable as it could be. I’ve filed a few bug reports and feature requests against the time slider that could improve discoverability, but if you have any other ideas, please chime in:
- Time slider date labels are redundant to date-editing controls · Issue #648 · OpenHistoricalMap/issues · GitHub
- Time slider should visualize temporal coverage distribution · Issue #649 · OpenHistoricalMap/issues · GitHub
- Time slider should overscroll by adjusting date range · Issue #911 · OpenHistoricalMap/issues · GitHub
Then one would just have to bookmark the page, right? Because that doesn’t save it as a default for your browser.
Ah, I didn’t realize you were trying to get around the time slider’s forgetfulness. We have an old issue tracking that. I just took a look again and it seems straightforward to fix:
I just realized this doesn’t even work as I thought. It’s just temporary, meaning I have to manually restart it if Firefox restarts.